
 Email Alerts
 RSS
RSS
Variations in extreme water level responses to rainstorms in the Yinzhou Plain of the Yongjiang River Basin
-
摘要:
为深刻揭示变化环境下甬江流域鄞州平原区雨洪关系特征,以姜山水文站为例,基于1962—2021年逐日降水和水位观测资料,利用分位数扰动法和极端降雨水位时变相关模型,从扰动过程和时变关系两个方面,探讨了水位对极端暴雨的响应特征演变趋势。结果表明:近60年姜山水文站年最大1、3 d降水量和年最大水位均呈显著上升趋势,变化倾向率分别为8.39 mm/10 a、12.66 mm/10 a和0.67 m/10 a;年最大1、3 d降水量和最大水位均呈现相似的阶段性扰动特征,即1960—1984年以负扰动为主,1985—2012年扰动强度较为平稳,2013—2021年为显著扰动;在选用的12个模型中,Time-varing Normal、Time-varing Rotated Gumbel、Time-varing Symmetrized Joe-Clayton等3个动态时变响应模型能更好地拟合极端洪水对暴雨的响应。总体上,年最大水位对年最大3 d降水量的响应以1990s—2000s为高值期,呈现先升后降的阶段性特征。研究结果可以加深城镇化对雨洪关系影响机制的认知,也可供区域洪涝灾害预警和预测参考。
Abstract:This study aims to elucidate the evolution of the storm-flood relationship in the Yinzhou Plain area of the Yongjiang Basin amidst changing environmental conditions. The responses of extreme water levels to heavy rains were analyzed over the period 1962 to 2021 at Jiangshan Station, considering disturbance characteristics and time-varying responses. The quantile disturbance method (QPM) and a time-varying correlation model were employed for this investigation. The findings revealed a significant increase in annual maximum 1-day/3-day precipitation and maximum water level, with rates of 8.39 mm/10a, 12.66 mm/10a, and 0.67 m/10a, respectively. The three indicators exhibited similar temporal perturbation patterns over the last 60 years according to QPM. Disturbances were predominantly negative from 1960 to 1984 and significantly positive from 2013 to 2021. Among the 12 selected models, the three time-varying models—Time-varying Normal, Time-varying Rotated Gumbel, and Time-varying Symmetrized Joe-Clayton—provided better fits for rainstorm-flood correlations. Generally, the response of annual maximum water level to annual maximum 3-day precipitation exhibited a stage characteristic of first rising and then falling. The high values of correlation were predominantly observed from the 1990s to the 2000s. These results enhance our understanding of the influence of urbanization on extreme precipitation-water level relationships and play a crucial role in the early warning and prediction of regional flood disasters.
-
就灾害发生的时空范围、频次及对人类生存与社会经济发展的危害程度而言,洪涝灾害居中国各类自然灾害之首[1-3]。洪灾高发区主要集中在人口和社会财富高度集中的长江中下游和华南等地[1]。中国东南沿海地区地形复杂,小流域众多,且多独流入海。受到地形和潮位等因素的影响,流域上游汇水速度快,下游排水不畅。且台风多发,暴雨和风暴潮遭遇的可能性较大,洪灾较其他区域更加严重。同时,东南沿海地区经济发达,城镇化水文效应显著,水文情势更加复杂化。一方面,城镇用地的快速扩张和河湖系统的萎缩,加剧了区域洪水产蓄矛盾,使得“小雨大灾”现象愈发严重[4-5];另一方面,不断兴建的城市圩垸等防洪工程系统扰乱了汇流过程,使得洪水对暴雨事件的响应特征出现变化[6-7]。厘清流域极端降水和水位的响应关系,将有助于深化认知区域水文条件、提高洪水灾害应对能力。
城镇化等人类活动对水文过程的影响是多方面的。首先,快速城镇化进程深刻改变了下垫面特征,形成了大量人工建筑物和硬质地表,改变了局部大气环流特征。众多学者或利用雨量站点观测和卫星遥感反演等降水资料,横向对比城区与郊区在降雨总量、降雨强度和降水历时等指标方面的差异性[8-10];或借助理论物理数值模型等手段试图揭示城镇化对降水的影响机制[11-12]。总体上,城镇化对极端降水过程的影响相对较大,城市下风向地区降水有所增加。主要可归纳为城市热岛效应、阻碍效应和凝结核效应三大原因[13-17]。其次,不透水面积扩张削弱了降水、地表水和地下水之间的水文联系,河湖系统衰退降低了其对洪水的调蓄能力,防洪工程建设引发了洪水空间转移等问题。目前,由于城镇化滨海平原区水文过程影响因素众多,构建水文水力学模型所需的条件苛刻,多以暴雨洪水场次过程为例,展开情景模拟,揭示特定条件下的暴雨洪水响应特征。关于水文气象要素变化趋势和响应关系的统计学分析方法主要有线性回归、Mann-Kendall趋势检验、Spearman’s rho检验分析、Theil-Sen回归分析和小波相干等[18-21]。这些方法能够较好地揭示要素的变化趋势,但对过程性阶段特征的描述稍显不足,且使用时受到一些假设条件的限制[22-23]。如水文气象变量的自相关性,可能会放大趋势检验结果。实际上,人类活动对洪水过程的影响具有阶段性特征,且作用方式有渐变和突变之分。有学者尝试开展长序列洪水事件识别,揭示太湖流域不同时期洪水涨退过程对暴雨的响应[24-25]。不过,当前雨洪关系研究仍以静态分析为主,不能从长时间序列上识别城镇化引起的“小雨大灾”现象。因此,需要借助有效的方法和模型,反映区域暴雨洪水响应关系和联动性阶段特征,阐述不同时期人类活动对水文变化的影响方式,并识别未来的变化趋势[26]。
甬江流域位于浙江省东北部,是典型的独流入海小流域,特别是流域下游的鄞州平原区,水文过程受到暴雨、潮位和过境洪水等多要素的综合影响,加之城镇化水文效应显著,人水矛盾突出,洪涝灾害危害较大。近年来,为降低洪水威胁,采取了大量水利工程措施。一方面,将上游洪水经东江引入奉化江,减少过境水量;另一方面,疏通甬新河等区域干流,并沿甬江和奉化江设置了闸泵工程,提高了高潮位时的强排能力。鉴于此,在揭示鄞州平原区极端降水和水位变化趋势的基础上,引入分位数扰动法,有效揭示水文气象要素的阶段性特征[27-29];同时,利用静态相关和动态时变联合分布模型[30-34],系统性揭示城镇化等人类活动对水位和极端降水关系的正负反馈效应及其阶段性特征,以期为区域防洪减灾提供参考。
1. 研究区概况与数据来源
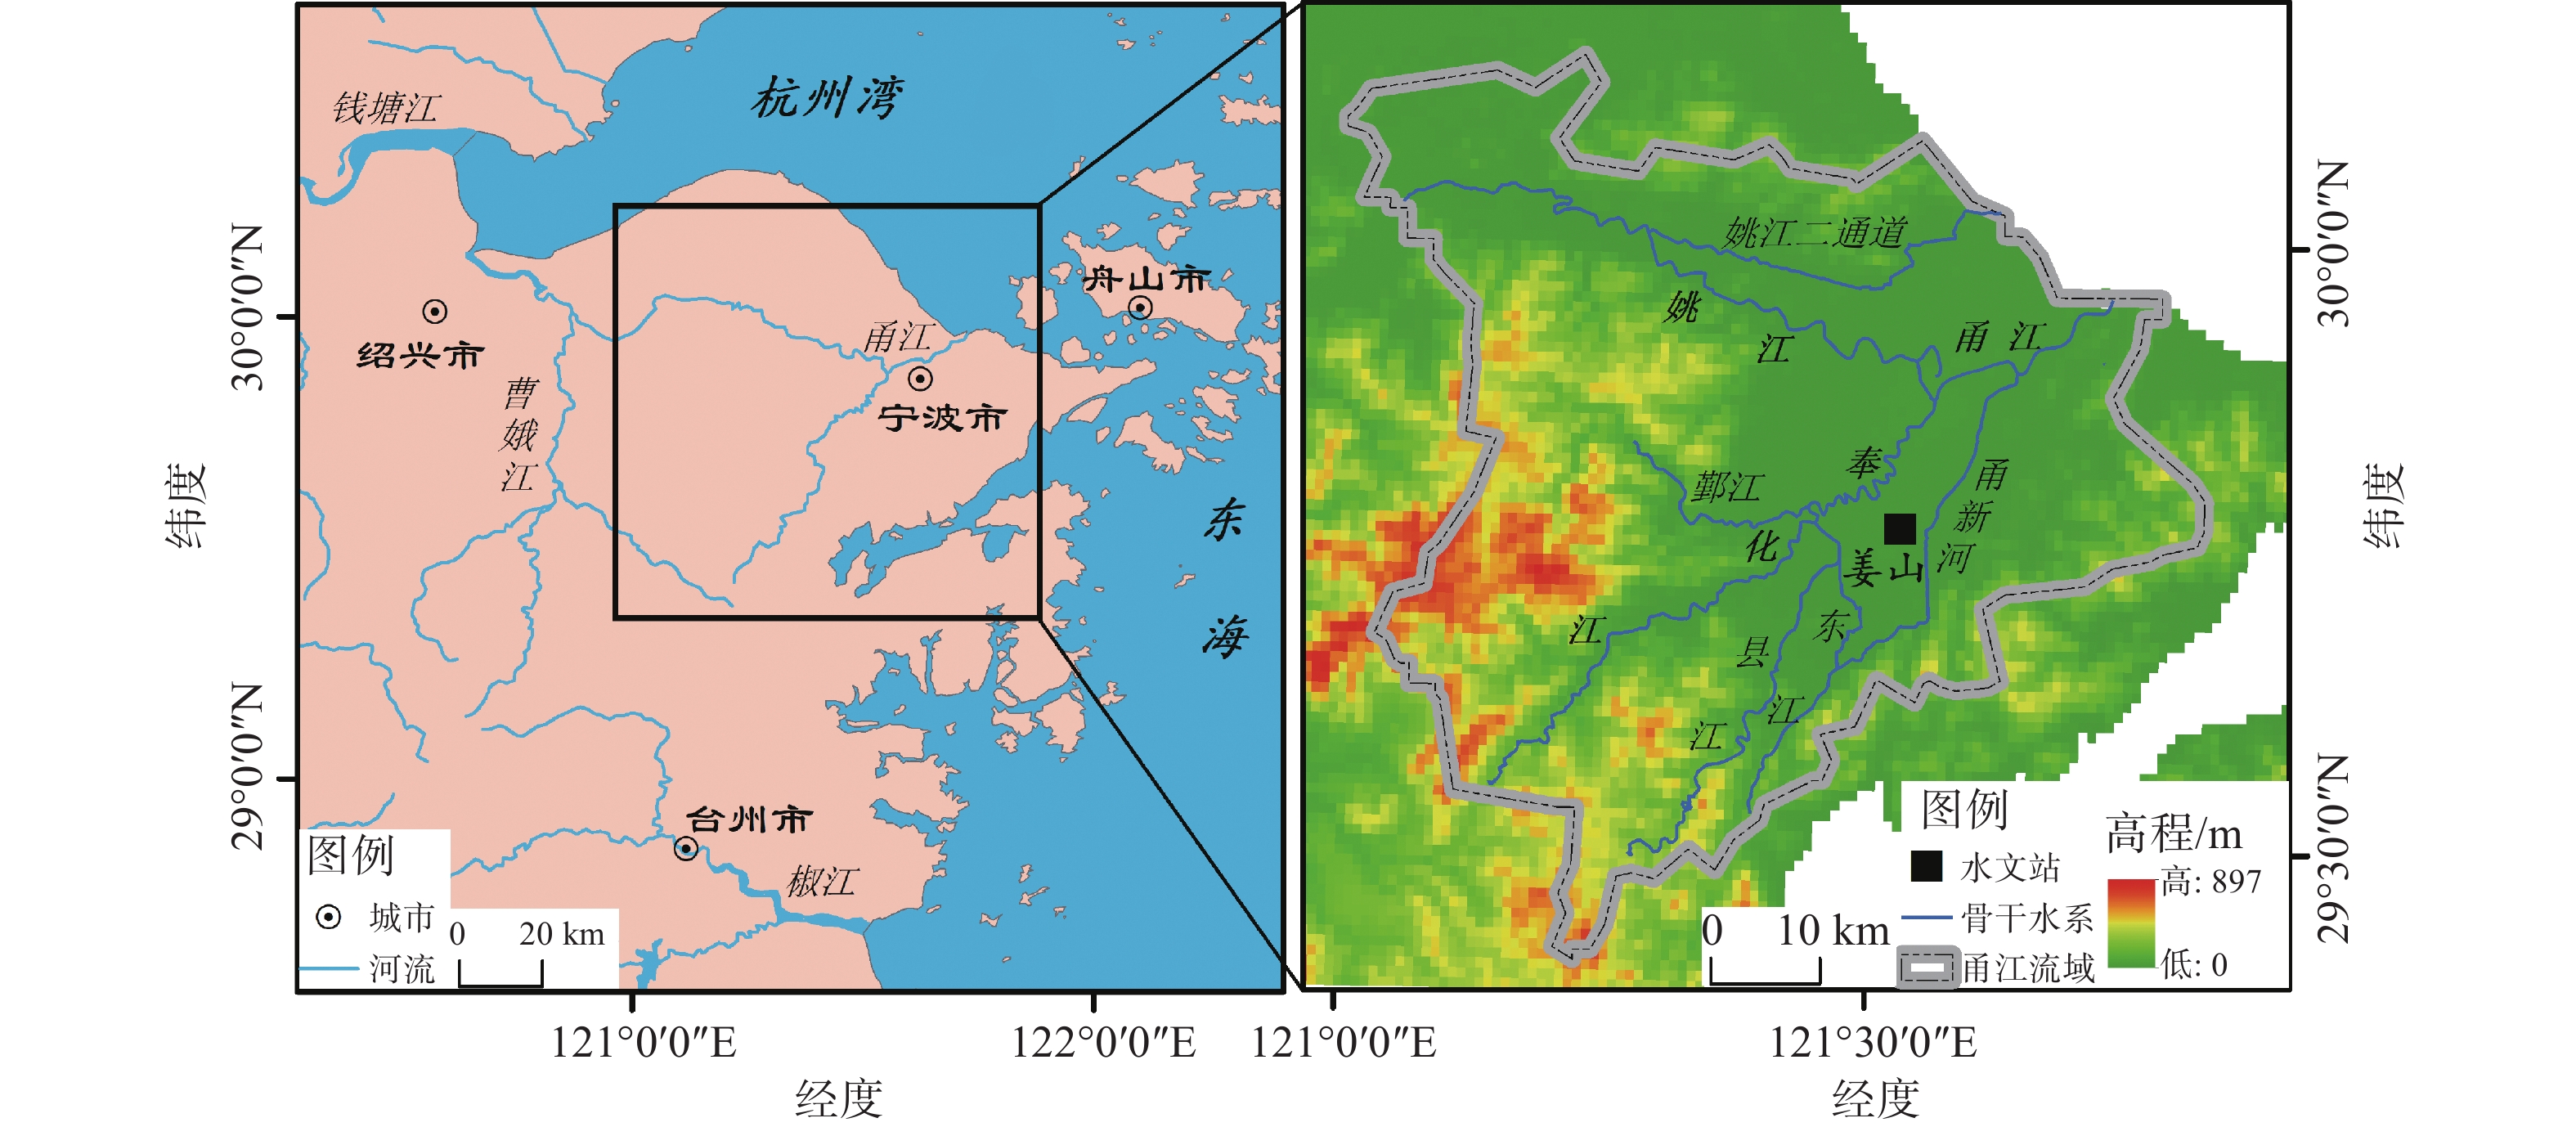
甬江流域(图1)属亚热带季风气候区,多年平均降水量约1 500 mm,一般4—9月降雨量约占全年雨量的70%。上游源头有姚江和奉化江两支,并由此划分出三大片区。其中,奉化江-甬江以东为鄞东南片区,奉化江以西、姚江以南为鄞西片区,姚江-甬江以北为江北-镇海片区。鄞东南片区上游为天台山余脉,溪流源短流急,汇水速度快。片区下游的鄞州平原区地势低平,河网交错,并受海洋潮位的影响,排水不畅,洪水情势复杂。同时,鄞州平原区是宁波市经济发达和人口集中区域,城镇用地面积日益扩大,河湖系统破坏严重,城镇化水文效应显著,洪水灾害严重。
姜山站是重要的区域水文控制站,所在区域是鄞州平原区地势低洼地区,且水文过程受山区河流(县江和东江)上游来水和甬新河行洪通道的综合影响。考虑到降水和水位资料的完整性与同步性,以姜山站1962—2021年相关资料为基础开展研究分析,降水和水位数据均来源于宁波市鄞州区水利局。
2. 研究方法
2.1 分位数扰动法
为深入分析鄞州平原区近几十年极端降水和水位关系的演变特征,采用分位数扰动法,该方法通过比较片段期与基准期之间的关系,不仅可以揭示水文气象序列的变化趋势,还能在一定程度上反映时间序列的年代际周期变化过程[27-29]。其中,基准期即为整个时间序列(本文为1962—2021年),片段期则是从基准期中选取的时间片段。主要计算步骤如下:(1)选取年最大1 d和3 d降水量,并获取对应时段的年最大水位,形成基准期极端降水和水位的时间序列;(2)从基准期中选取长度为5、7、10或15 a的片段期子序列。若子序列长度(Block Length, LB)为5 a,可挑选出1962—1966年、1967—1971年、……、2017—2021年。并设置滑动窗口期,形成连续性子序列。当滑动窗口为1 a时,下一个子序列即为1963—1967年、1968—1972年、……,以此类推;(3)将各子序列中的数值降序排列,并分别计算其理论回归周期(LB /i,i为子序列排序号)。因此,子序列各降水量值所对应的分位数为x(LB)、x(LB /2)、x(LB /3)、……、x(LB /i);(4)重复上述操作,计算基准期的理论回归周期。当基准期长度为60 a,各降水量值所对应的分位数为xg(60)、xg(60/2)、xg(60/3)、……、xg(60/60);(5)分别计算x(LB)/xg(LB)、x(LB /2)/xg(LB /2)、x(LB /3)/xg(LB /3)、……,该子序列分位数扰动值即为以上数值的平均值。为获取置信区间,利用Monte Carlo非参数自举推断模型,将基准期数据打乱,随机生成新的数据序列1 000次,并重新提取子序列和计算分位数扰动值。将每个子序列所生成的分位数扰动值按由大到小排序,将25 th和975 th分位值定义为0.05的置信区间。
2.2 暴雨洪水联合分布模型
Copula理论目前在水文气象等领域得到广泛应用,特别是在极端暴雨洪水等多变量频率分析方面。Copula模型是根据极端降水、水位的单变量边际分布建立的联合分布[30-32]。对于二元Copula而言,联合分布H(x, y)可以写成:
$$ H (x, y)=C (F(x), G(y)) $$ (1) 式中:F(x)和G(y)为边缘分布函数。因此,边缘分布函数的逆函数为$ F^{-1}\left(u\right),G^{-1}\left(v\right) $,Copula函数的求解表达式为:
$$ C\left(u,v\right)=H(F^{-1}\left(u\right),G^{-1}\left(v\right)) $$ (2) 式中:$ C\left(u,v\right) $称为Copula函数。
良好的单变量边际分布拟合是Copula函数拟合的基础。常见的单变量边际分布有P-III型分布、广义极值分布、对数正态分布等。将极端暴雨和洪水二要素进行联合的Copula函数主要有椭圆Copula函数族、阿基米德Copula函数族等。前者主要包括Normal Copula(Gaussian Copula)、Student t Copula等;后者主要有Clayton Copula、Frank Copula和Gumbel Copula等。作为一种较新的分析方法,Copula函数形式灵活。相较于线性静态相关等Copula方法,可以通过构建多元分布形式以反映降雨和水位序列的尾部相关性,从而捕捉到非线性相关特征。近年来,该方法开始应用于降雨水位关系的相关性研究[33-34]。以姜山站为代表站点,选取了Normal、Student t、Clayton、Gumbel、Plackett、Frank、Rotated Clayton(RC)、Rotated Gumbel(RG)、Symmetrized Joe-Clayton Copula(SJC)、Time-varing Normal(时变Normal)、Time-varing Rotated Gumbel(时变RG)和Time-varing Symmetrized Joe-Clayton(时变SJC)等多个Copula函数,进行极端暴雨洪水关系拟合分析。本文采用的Copula函数及其表达式如下:
(1)Normal Copula
$$ {C}_{\mathrm{N}}({u}_{1},{u}_{2};\rho )={{\varPhi }}_{\rho }({\varPhi }^{-1}({u}_{1})\text{,}{\varPhi }^{-1}\left({u}_{2}\right)) $$ (3) 式中:CN为Normal Copula相关性;u1和u2为参与计算的对象,即年最大3 d降水量和年最大水位;参数$ \rho $为u1和u2的相关系数;$ {\varPhi }_{\rho } $为二元Normal Copula;$ {\varPhi }^{-1} $为一元标准正态累计分布的逆函数。
(2)Student t Copula
$$ {C}_{\mathrm{T}}\left({u}_{1},{u}_{2};v,{\boldsymbol{\sigma}} \right)={t}_{v,{\boldsymbol{\sigma}} }({t}_{v}^{-1}\left({u}_{1}\right),{t}_{v}^{-1}\left({u}_{2}\right)) $$ (4) 式中:CT为Student t Copula相关性;$ t_{v,\boldsymbol{\sigma}} $为二元t分布;$ {t}_{v}^{-1} $是自由度为v的一元t分布的逆函数;${\boldsymbol{ \sigma}} $为对称协方差矩阵,$ {\boldsymbol{\sigma}} =\left[\begin{array}{ccc}1& \cdots & {{\sigma} }_{1d}\\ \vdots & \ddots & \vdots \\ {\sigma }_{1}& \cdots & 1\end{array}\right] $,d为随机变量的维数。
(3)Clayton Copula
$$ {C}_{\mathrm{C}}\left({u}_{1},{u}_{2};\theta \right)={({u}_{1}^{-\theta }+{u}_{2}^{-\theta }-1)}^{-\frac{1}{\theta }} $$ (5) 式中:CC为Clayton Copula相关性;$ \theta $为Copula函数的相关参数,$ \theta \in (0,\infty ) $。
(4)Gumbel Copula
$$ {C}_{\mathrm{G}}\left({u}_{1},{u}_{2};\theta \right)=\mathrm{e}\mathrm{x}\mathrm{p}(-{[{(-\mathrm{l}\mathrm{n}{u}_{1})}^{\theta }+{(-\mathrm{l}\mathrm{n}{u}_{2})}^{\theta }]}^{\frac{1}{\theta }} ) $$ (6) 式中:CG为Gumbel Copula相关性;$ {(-\mathrm{l}\mathrm{n}{u}_{1})}^{\theta } $为Gumbel Copula函数的生成元;$ \theta \in [1,\infty ) $。
(5)Plackett Copula
$$ C_{\mathrm{P}}\left(u_1,u_2;\theta\right)=\left\{\begin{aligned} & \frac{1}{2(\theta-1)}\left[1+\left(\theta-1\right)\left(u_1+u_2\right)-\sqrt{\left[1+\left(\theta-1\right)\left(u_1+u_2\right)\right]^2-4u_1u_2\theta\left(\theta-1\right)}\right], & \theta\ne1 \\ & u_1u_2, \theta=1 & \end{aligned}\right. $$ (7) 式中:CP为Plackett Copula;$ \theta > 0 $。
(6)Frank Copula
$$ {C}_{\mathrm{F}}\left({u}_{1},{u}_{2};\theta \right)=-\frac{1}{\theta }\mathrm{l}\mathrm{n}(1+\frac{(\mathrm{e}\mathrm{x}\mathrm{p}(-\theta {u}_{1})-1)(\mathrm{e}\mathrm{x}\mathrm{p}(-\theta {u}_{2})-1)}{\mathrm{e}\mathrm{x}\mathrm{p}(-\theta )-1}) $$ (8) 式中:CF为Frank Copula相关性;$ \theta \in \left(-\infty ,0\right)\bigcup \left(0,+\infty \right) $。
(7)RC Copula和RG Copula
$$ {C}_{\mathrm{R}\mathrm{C}}({u}_{1},{u}_{2};\theta )={C}_{{\mathrm{C}}}(1-{u}_{1},1-{u}_{2};\theta ) $$ (9) $$ {C}_{\mathrm{R}\mathrm{G}}({u}_{1},{u}_{2};\theta )={C}_{{\mathrm{G}}}(1-{u}_{1},1-{u}_{2};\theta ) $$ (10) 式中:CRC和CRG分别为RC Copula 和RG Copula相关性。
(8)SJC Copula
$$ {C}_{\mathrm{J}\mathrm{C}}\left(u,v;k,r\right)=1-{\left({\left\{{[1-{\left(1-u\right)}^{k}]}^{-r}+{[1-(1-{v}^{k}]}^{-r}-1\right\}}^{\frac{-1}{r}}\right)}^{\frac{1}{k}} $$ (11) $$ {C}_{\mathrm{S}\mathrm{J}\mathrm{C}}\left(u,v;k,r\right)=0.5 \ {C}_{\mathrm{J}\mathrm{C}}\left(u,v;k,r\right)+{C}_{\mathrm{J}\mathrm{C}}\left(1-u,1-v;k,r\right)+u+v-1 $$ (12) 式中:CJC和CSJC分别为 Joe-Clayton Copula和Symmetrized Joe-Clayton Copula相关性。
(9)时变Normal Copula
$$ {C}_{\mathrm{T}\mathrm{N}}(u,v;\rho )={\varPhi }_{\rho }({\varPhi }^{-1}(u),{\varPhi }^{-1}\left(v\right)) $$ (13) 式中:CTN为时变Normal Copula相关性。
(10)时变RG Copula
$$ {C}_{\mathrm{T}\mathrm{R}\mathrm{G}}={u}_{1}+{u}_{2}-1+\mathrm{e}\mathrm{x}\mathrm{p}\left\{{[{\left(-\mathrm{ln}\left(1-{u}_{1}\right)\right)}^{\theta }+{\left(-\mathrm{ln}\left(1-{u}_{2}\right)\right)}^{{\rho }_{\mathrm{R}\mathrm{G},t}}]}^{\frac{1}{\theta }}\right\} $$ (14) 式中:CTRG为时变RG Copula相关性。
(11)时变SJC Copula
$$ {C}_{\mathrm{T}\mathrm{S}\mathrm{J}\mathrm{C}}\left(u,v;{\tau }_{t}^{\mathrm{U}},{\tau }_{t}^{\mathrm{L}}\right)=0.5 \cdot {C}_{\mathrm{J}\mathrm{C}}\left(u,v;{\tau }_{t}^{\mathrm{U}},{\tau }_{t}^{\mathrm{L}}\right)+{C}_{\mathrm{J}\mathrm{C}}\left(1-u,1-v;{\tau }_{t}^{\mathrm{U}},{\tau }_{t}^{\mathrm{L}}\right)+u+v-1 $$ (15) 式中:CTSJC为时变SJC Copula相关性;$ {\tau }_{t}^{\mathrm{U}}\mathrm{和}{\tau }_{t}^{\mathrm{L}} $分别为上下尾系数。
在样本数量有限的条件下,采用基于最大似然估计评估下的AIC(Akaike Information Criterions)和BIC(Bayesian Information Criterions)指标进行优选,寻找最优拟合线型,深入探讨近几十年年最大3 d降水量与年最大水位之间的关系。
$$ R_{{\rm{AIC}}}=2k-2\ln L $$ (16) $$ R_{{\rm{BIC}}}=(\ln n)k-2\ln L $$ (17) 式中:k为参数的数量;L为似然函数;n为样本数量。
3. 结果与分析
3.1 鄞州平原区极端降水和水位变化特征
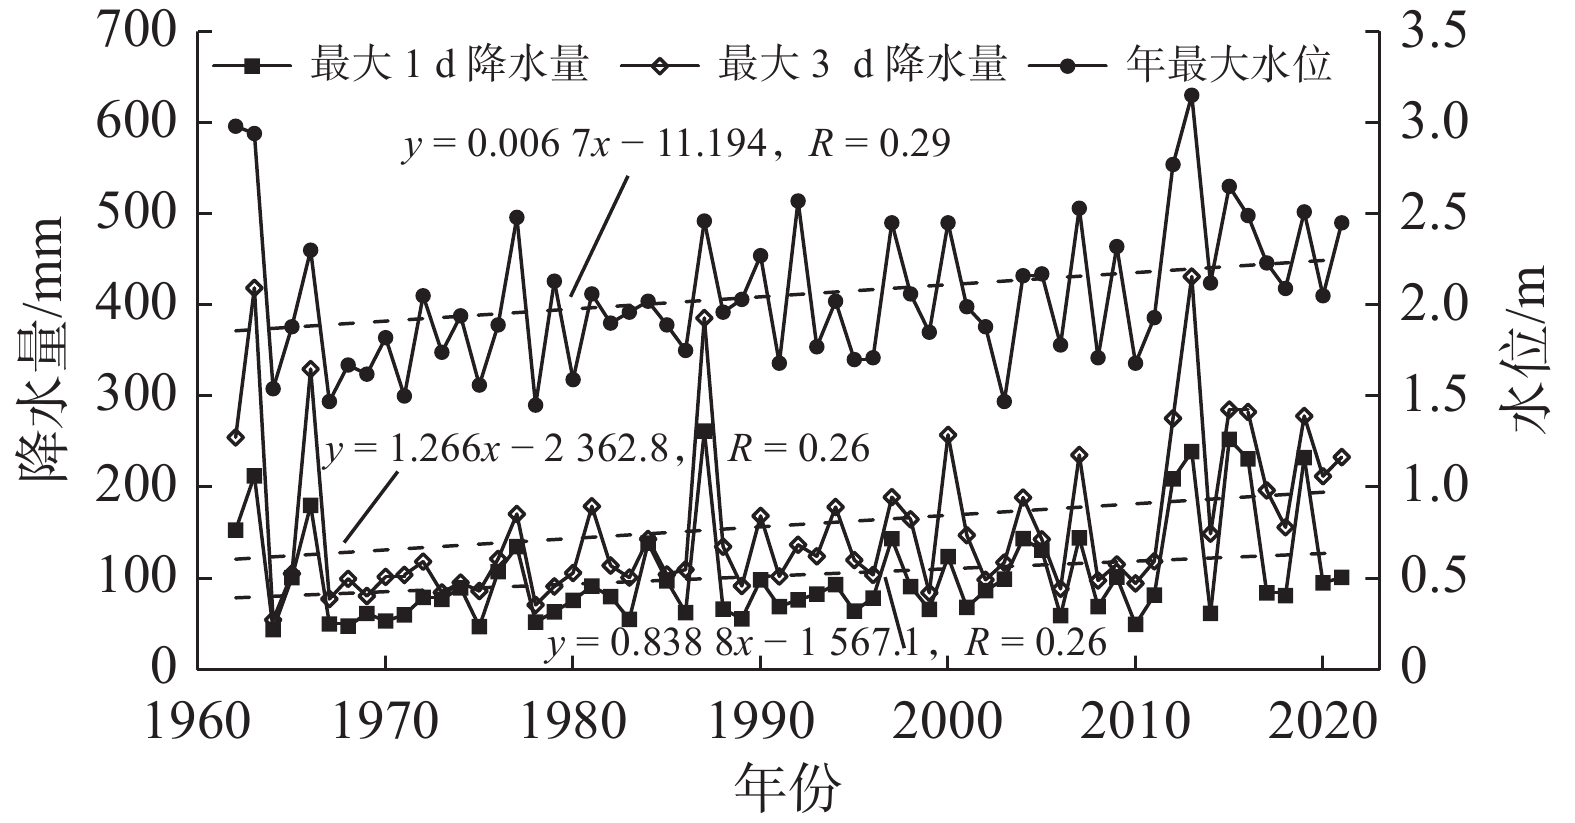
为直观描述近60年鄞州平原区极端降水和水位年际变化特征,建立姜山站最大1、3 d降水量和年最大水位年际变化时间序列,并利用最小二乘法进行线性趋势拟合(图2)。由图2可见:1962—2021年的年最大1、3 d降水量变化趋势较为一致,均呈显著增加趋势(p>0.05),变化倾向率分别为8.39和12.66 mm/10 a。近60年中,最大1 d降水量超过200 mm的共有7个年份:1987(261.5 mm)、2015(252.5 mm)、2013(239.0 mm)、2016(231.0 mm)、2019(232.5 mm)、1963(212.5 mm)和2012(209.0 mm)。其中,有5个集中在2010s。年最大3 d降水量较大的年份也出现在2010s;另,姜山站的年最高水位均呈上升趋势,变化倾向率为0.067 m/10 a,最大水位达3.15 m(2013年)。
![]() 图 2 年最大1、3 d降水量和最大水位时间序列Figure 2. Time series analysis of annual maximum 1-day/3-day precipitation and maximum water level
图 2 年最大1、3 d降水量和最大水位时间序列Figure 2. Time series analysis of annual maximum 1-day/3-day precipitation and maximum water level为进一步分析该站点极端降水和水位变化趋势,引入世界气象组织推荐使用的气象水文要素时间序列非参数检验方法Mann-Kendall突变趋势检验法。但该方法计算结果受到原始数据自相关的影响,故引入TFPW-MK方法对原始数据进行预置白处理,消除部分趋势项,提高计算精度[35]。计算结果显示姜山站年最大1、3 d降水量和最大水位时间序列的标准化统计量Z值分别为2.62、3.41和2.85,均大于0.05置信度水平临界值的1.96,说明近几十年该地区极端降水水位均呈显著上升趋势。
3.2 极端降水水位扰动关系
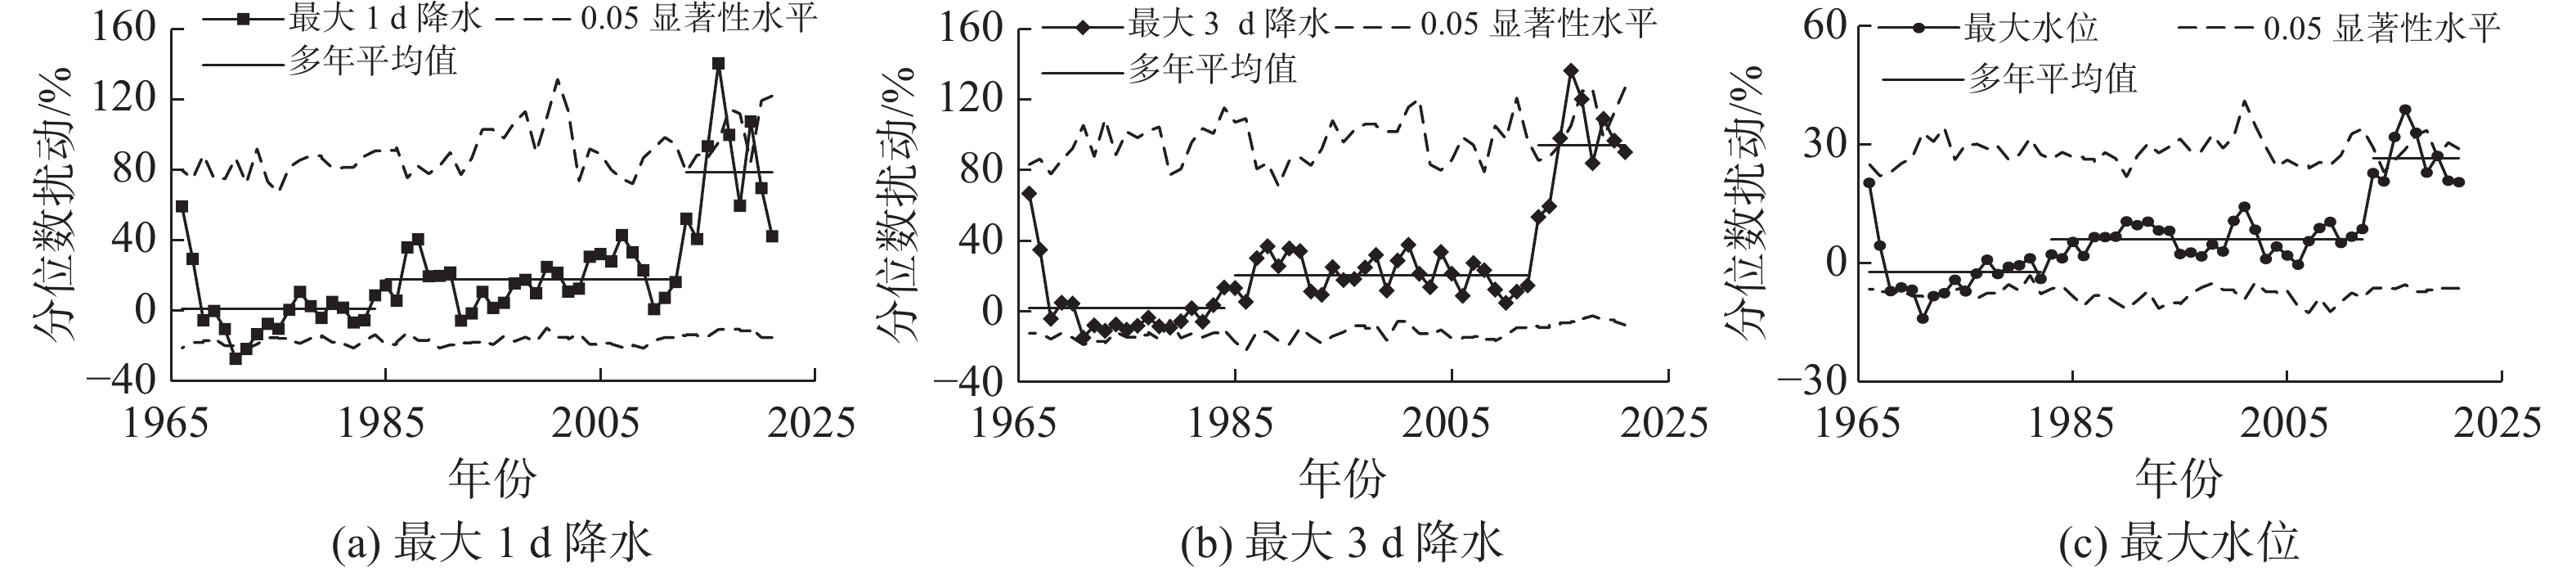
通过对比姜山站年最大1、3 d降水量和最大水位分位数扰动时间序列发现,年极端降水和水位分位数扰动变化过程较为相似(图3)。从演变过程看:三者的分位数扰动在1985年之前主要为负值,其中1970年前后负扰动达到了0.05的置信度检验;1985—2012年,三者的扰动强度较为平稳,年最大1、3 d降水量序列总体上介于0~40%,年最大降水量序列介于0~15%;2013年以后,极端降水和水位序列的分位数扰动快速上升,并达到了0.05的置信度检验。由此可见,近60年鄞州平原区极端降水和水位演变呈现明显的阶段性特征。
![]() 图 3 姜山站最大1、3 d降水和最大水位分位数扰动过程Figure 3. Fluctuations in annual maximum 1-day/3-day precipitation and maximum water level
图 3 姜山站最大1、3 d降水和最大水位分位数扰动过程Figure 3. Fluctuations in annual maximum 1-day/3-day precipitation and maximum water level3.3 极端降水水位时变关系分析
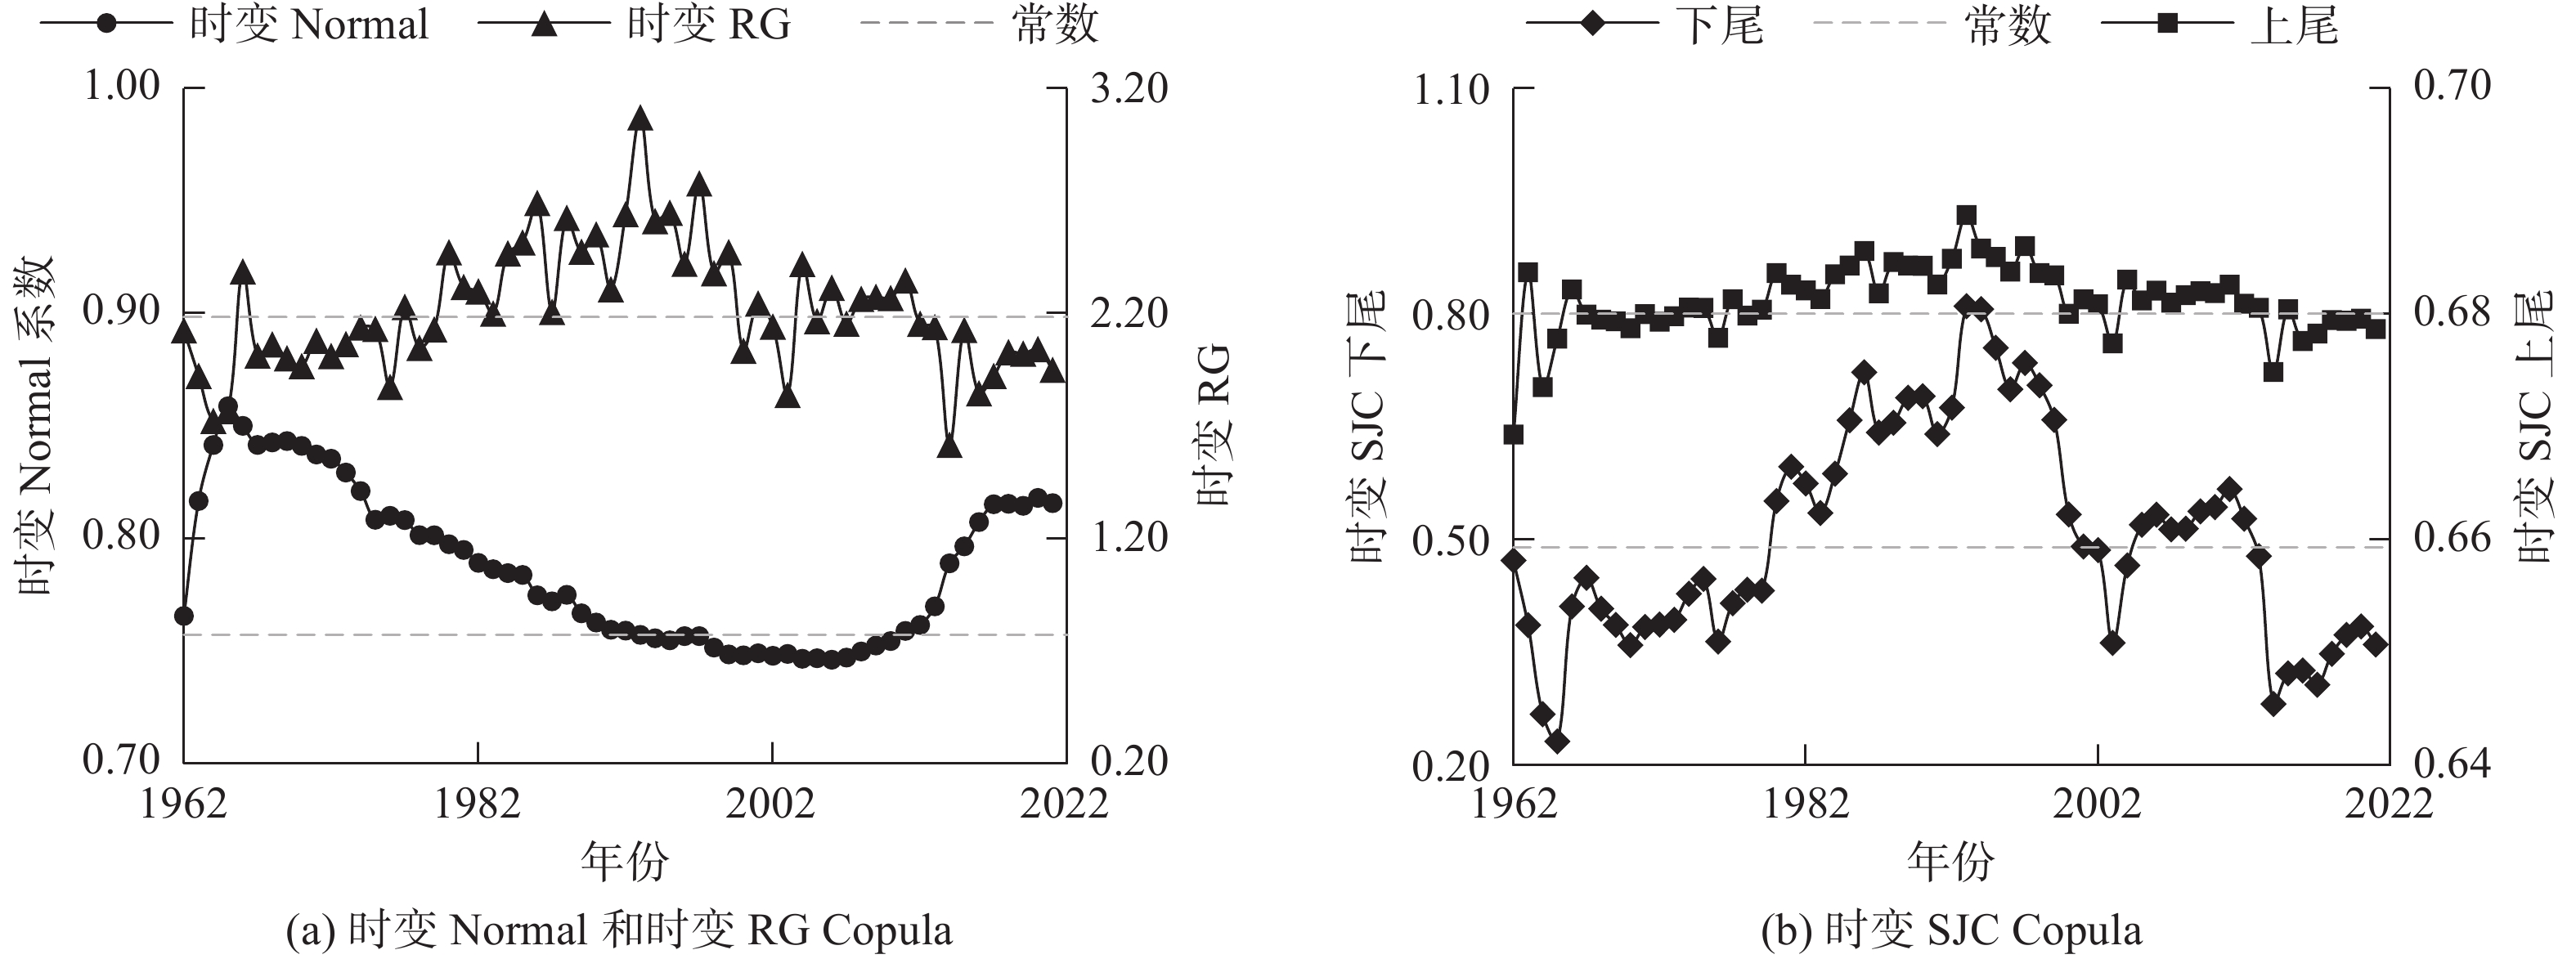
采用基于最大似然估计下的RAIC和RBIC指标进行优选,寻找最优拟合线型,深入探讨近几十年极端洪水对暴雨的响应性演变特征。二元Copula函数的拟合优度检验见表1,RAIC和RBIC值均小于−35,可知静态和时变Copula函数对极端降水水位拟合的效果均较好。其中,时变Copula函数的拟合效果略好。考虑到动态时变Copula对尾部相关性更加敏感,对其进行极端水位响应性特征时间演变序列分析。图4中的数值表达了二者响应性的强弱。由图4(a)可见,二者的响应性以1990s—2000s为高值期,形成了先升后降的阶段性特征。相较于时变Normal和RG Copula函数,时变SJC Copula函数对上下尾部响应性均比较敏感,能更好表达二者间的响应。上尾和下尾响应系数分别表示当年最大3 d降水量上升或下降时,年最大水位随之上升或下降的响应性(图4(b))。一方面,从上尾响应性时间序列看,极端水位的上升对降水的响应系数较高。近几十年上尾相应系数总体变化不大,1980s—1990s期间响应性相对更高;另一方面,下尾响应性总体波动幅度大于上尾响应性,呈先升后降,下降响应性在1960s—1990s期间不断强化,在2000s以后逐渐变差。
表 1 Copula函数对极端降水水位拟合的RAIC值和RBIC值Table 1. The RAIC and RBIC to the fitting of extreme precipitation and water level by Copula functionCopula函数 RAIC RBIC Copula函数 RAIC RBIC Normal −52.85 −52.82 Rotated Gumbel −45.26 −45.23 Clayton −35.63 −35.59 Student t −53.58 −53.51 Rotated Clayton −47.29 −47.25 Symmetrized Joe-Clayton −51.16 −51.09 Plackett −52.34 −52.31 Time-varing Normal −54.00 −53.89 Frank −52.58 −52.55 Time-varing Rotated Gumbel −57.81 −57.71 Gumbel −53.23 −53.19 Time-varing Symmetrized Joe-Clayton −62.68 −62.47 ![]() 图 4 基于时变Normal、RG和SJC Copula的极端降水和水位响应关系Figure 4. Relations between extreme precipitation and water level by the time-varing Normal, RG and SJC Copula Function
图 4 基于时变Normal、RG和SJC Copula的极端降水和水位响应关系Figure 4. Relations between extreme precipitation and water level by the time-varing Normal, RG and SJC Copula Function3.4 讨 论
通过前文分析可知,近几十年来甬江流域鄞州平原区极端水位呈上升趋势,其对暴雨的响应性特征也出现了显著的阶段性变化。首先,近年来甬江流域鄞东南地区经历了快速城镇化进程。2000s以来,宁波市在鄞州区陆续启动了“东部新城”和“南部商务区”等城市发展战略,城镇用地占比由1990年的8.25%快速增加至2020年的40.79%。同时,该地区的河流系统遭到了严重破坏。1990—2010年间,研究区河网密度和水面率均呈减少趋势,河网密度由1990年的3.9 km/km2减少到2010年的3.2 km/km2,减少了近20%;水面率由1990年9.5%减少到2010年的6.7%,减少了近30%。由此引发水系对洪涝的调控能力逐渐下降。据测算,1990s—2010s期间,鄞东南地区水系对洪水的槽蓄能力和可调蓄能力均下降了30%以上,区域产需矛盾突出[4-5]。其次,水利工程设施改变了区域汇流过程。鄞州平原区上游于1980s以来陆续建有3座中型水库(即横溪水库、东钱湖水库和三溪浦水库)和东江闸等水利工程,汛期河网与水库实行综合调度,减少上游来水;下游则沿奉化江和甬江沿线建有堤防和碶闸,主要有铜盆浦闸、庙堰碶、杨木碶、鄞东闸、甬新闸和梅墟碶等20多座。洪水期间,防止外江洪水倒灌,并加大区域内洪水外排能力。在两大原因的综合影响下,极端水位快速上升,但极端降水和水位响应性呈现先升后降的阶段性演变过程。这与太湖流域有相似之处,年最大水位的上升主要与洪水事件的起涨水位上升有关,这有助于保证区域水质状况和生态用水量。同时,在区域防洪工程系统建设与洪水联合调度下,流域性极端洪水事件和“小雨大灾”现象有所缓解[24-26]。
洪涝灾害是威胁平原水网地区城市经济发展的主要自然灾害,目前人类不可能完全消除洪涝灾害,因此要树立人与洪水和谐相处的思想、给洪水以出路的防洪理念,降低洪水风险。因此,针对鄞州平原区的洪涝问题,首先,应充分考虑下垫面的蓄水能力,将水系保护和海绵城市建设等工作纳入到各层次的城市规划中,形成一套长效管理机制,维持和提高流域水面率和下渗能力等指标,增强城市的洪涝蓄滞与消纳能力;其次,统筹城市圩垸防洪工程的建设与调度。面对不断提升的城市防洪标准和排涝强度,应统筹协调城市排涝需求与区域防洪能力的关系,充分考虑其与流域、区域防洪的协调,提高城市防洪工程调度与管理水平,减少调度造成的洪水空间转移问题。
4. 结 语
基于姜山站1962—2021年日尺度降水和水位观测资料,采用分位数扰动和时变Copula模型,对甬江流域鄞州平原区极端洪水对暴雨的响应性特征,可得出以下结论:总体上,1962—2021年鄞州平原区姜山水文站年最大1、3 d降水量和年最大水位均呈显著上升趋势,区域防洪压力较大;姜山站年最大1、3 d降水量和最大水位的分位数扰动变化过程具有相似的阶段性演变特征,即1985年之前以负值为主,1985—2012年间扰动强度较为平稳,2013年以后极端降水和水位序列的分位数扰动快速上升,并达到了0.05的置信度检验;姜山站年最大水位对年最大3 d降水量的响应以1990s—2000s为高值期,形成了先升后降的阶段性特征。其中,上尾和下尾相关性均呈现出先升后降的现象,前者波动性较小,说明2000s以后极端降水和水位要素的联动性逐渐变差。
-
![]()
图 2 年最大1、3 d降水量和最大水位时间序列
Figure 2. Time series analysis of annual maximum 1-day/3-day precipitation and maximum water level
![]()
图 3 姜山站最大1、3 d降水和最大水位分位数扰动过程
Figure 3. Fluctuations in annual maximum 1-day/3-day precipitation and maximum water level
![]()
图 4 基于时变Normal、RG和SJC Copula的极端降水和水位响应关系
Figure 4. Relations between extreme precipitation and water level by the time-varing Normal, RG and SJC Copula Function
表 1 Copula函数对极端降水水位拟合的RAIC值和RBIC值
Table 1 The RAIC and RBIC to the fitting of extreme precipitation and water level by Copula function
Copula函数 RAIC RBIC Copula函数 RAIC RBIC Normal −52.85 −52.82 Rotated Gumbel −45.26 −45.23 Clayton −35.63 −35.59 Student t −53.58 −53.51 Rotated Clayton −47.29 −47.25 Symmetrized Joe-Clayton −51.16 −51.09 Plackett −52.34 −52.31 Time-varing Normal −54.00 −53.89 Frank −52.58 −52.55 Time-varing Rotated Gumbel −57.81 −57.71 Gumbel −53.23 −53.19 Time-varing Symmetrized Joe-Clayton −62.68 −62.47  下载: 导出CSV
-
[1] 杨柳, 范子武, 谢忱, 等. 城镇化背景下我国城市洪涝灾害演变特征[J]. 水利水运工程学报,2018,4(2):10-18. (YANG Liu, FAN Ziwu, XIE Chen, et al. Study on evolvement law of urban flood disasters in China under urbanization[J]. Hydro-Science and Engineering, 2018, 4(2): 10-18. (in Chinese) YANG Liu, FAN Ziwu, XIE Chen, et al. Study on evolvement law of urban flood disasters in China under urbanization[J]. Hydro-Science and Engineering, 2018, 4(2): 10-18. (in Chinese)
[2] WANG X J, XIA J Q, DONG B L, et al. Spatiotemporal distribution of flood disasters in Asia and influencing factors in 1980-2019[J]. Natural Hazards, 2021, 108(3): 2721-2738. doi: 10.1007/s11069-021-04798-3
[3] 马定国, 刘影, 陈洁, 等. 鄱阳湖区洪灾风险与农户脆弱性分析[J]. 地理学报,2007,62(3):321-332. (MA Dingguo, LIU Ying, CHEN Jie, et al. Farmers’ vulnerability to flooding in the Poyang Lake region[J]. Acta Geographica Sinica, 2007, 62(3): 321-332. (in Chinese) MA Dingguo, LIU Ying, CHEN Jie, et al. Farmers’ vulnerability to flooding in the Poyang Lake region[J]. Acta Geographica Sinica, 2007, 62(3): 321-332. (in Chinese)
[4] WU Y Q, XU Y, ZHAO Y, et al. Evolution of river network due to urbanization in the Southeast Yinzhou Plain of Yongjiang River Basin, China[J]. Journal of Cleaner Production, 2022, 379: 134718. doi: 10.1016/j.jclepro.2022.134718
[5] YANG L, XU Y P, HAN L F, et al. River networks system changes and its impact on storage and flood control capacity under rapid urbanization[J]. Hydrological Processes, 2016, 30(13): 2401-2412. doi: 10.1002/hyp.10819
[6] 雷超桂, 许有鹏, 张倩玉, 等. 流域土地利用变化对不同重现期洪水的影响: 以奉化江皎口水库流域为例[J]. 生态学报,2016,36(16):5017-5026. (LEI Chaogui, XU Youpeng, ZHANG Qianyu, et al. Impacts of land-use change on flood process and frequency of various return periods: a case study of Jiaokou Reservoir watershed in Fenghua River[J]. Acta Ecologica Sinica, 2016, 36(16): 5017-5026. (in Chinese) LEI Chaogui, XU Youpeng, ZHANG Qianyu, et al. Impacts of land-use change on flood process and frequency of various return periods: a case study of Jiaokou Reservoir watershed in Fenghua River[J]. Acta Ecologica Sinica, 2016, 36(16): 5017-5026. (in Chinese)
[7] 郑建根, 张松达, 谢敏, 等. 宁波市三江河道水沙变化规律及成因分析[J]. 长江科学院院报,2018,35(5):6-11. (ZHENG Jiangen, ZHANG Songda, XIE Min, et al. Characteristics and causes of flow and sediment change in Three Rivers of Ningbo city[J]. Journal of Yangtze River Scientific Research Institute, 2018, 35(5): 6-11. (in Chinese) ZHENG Jiangen, ZHANG Songda, XIE Min, et al. Characteristics and causes of flow and sediment change in Three Rivers of Ningbo city[J]. Journal of Yangtze River Scientific Research Institute, 2018, 35(5): 6-11. (in Chinese)
[8] CHANGNON S. Operational-design information for severe winter storms in Illinois[J]. Bulletin of the American Meteorological Society, 1971, 52(6): 508-514.
[9] LIU J, NIYOGI D. Meta-analysis of urbanization impact on rainfall modification[J]. Scientific Reports, 2019, 9: 7301. doi: 10.1038/s41598-019-42494-2
[10] MOTE T L, LACKE M C, SHEPHERD J M. Radar signatures of the urban effect on precipitation distribution: a case study for Atlanta, Georgia[J]. Geophysical Research Letters, 2007, 34(20): L20710.
[11] HAN L F, YU X Q, XU Y P, et al. Enhanced summertime surface warming effects of long-term urbanization in a humid urban agglomeration in China[J]. Journal of Geophysical Research: Atmospheres, 2021, 126((21): ): e2021JD035009. doi: 10.1029/2021JD035009
[12] ROGELIS M C, WERNER M. Streamflow forecasts from WRF precipitation for flood early warning in mountain tropical areas[J]. Hydrology and Earth System Sciences, 2018, 22(1): 853-870. doi: 10.5194/hess-22-853-2018
[13] FAN J W, ZHANG Y W, LI Z Q, et al. Urbanization-induced land and aerosol impacts on sea-breeze circulation and convective precipitation[J]. Atmospheric Chemistry and Physics, 2020, 20(22): 14163-14182. doi: 10.5194/acp-20-14163-2020
[14] ZHANG W, VILLARINI G, VECCHI G A, et al. Urbanization exacerbated the rainfall and flooding caused by hurricane Harvey in Houston[J]. Nature, 2018, 563(7731): 384-388. doi: 10.1038/s41586-018-0676-z
[15] DENG X J, XU Y P, HAN L F, et al. Spatial-temporal changes in the longitudinal functional connectivity of river systems in the Taihu Plain, China[J]. Journal of Hydrology, 2018, 566: 846-859. doi: 10.1016/j.jhydrol.2018.09.060
[16] GAO Y Q, YUAN Y, WANG H Z, et al. Analysis of impacts of polders on flood processes in Qinhuai River Basin, China, using the HEC-RAS model[J]. Water Supply, 2018, 18(5): 1852-1860. doi: 10.2166/ws.2018.008
[17] CHENG X T, EVANS E P, WU H Y, et al. A framework for long-term scenario analysis in the Taihu Basin, China[J]. Journal of Flood Risk Management, 2013, 6(1): 3-13. doi: 10.1111/jfr3.12024
[18] XU Y, WU Y F, XU G. Variation of reference evapotranspiration and its teleconnection with multiple large-scale climate oscillations in the Yangtze River Delta, China[J]. International Journal of Climatology, 2019, 39(5): 2630-2645. doi: 10.1002/joc.5977
[19] NALLEY D, ADAMOWSKI J, KHALIL B. Using discrete wavelet transforms to analyze trends in streamflow and precipitation in Quebec and Ontario (1954-2008)[J]. Journal of Hydrology, 2012, 475: 204-228. doi: 10.1016/j.jhydrol.2012.09.049
[20] YANG P, XIA J, ZHANG Y Y, et al. Temporal and spatial variations of precipitation in Northwest China during 1960-2013[J]. Atmospheric Research, 2017, 183: 283-295. doi: 10.1016/j.atmosres.2016.09.014
[21] 吴雷, 许有鹏, 王强, 等. 长三角地区夏季降水结构演变及其非平稳性[J]. 水科学进展,2022,33(5):730-742. (WU Lei, XU Youpeng, WANG Qiang, et al. Evolution and non- stationary characteristics of summer precipitation structure over the Yangtze River Delta[J]. Advances in Water Science, 2022, 33(5): 730-742. (in Chinese) WU Lei, XU Youpeng, WANG Qiang, et al. Evolution and non- stationary characteristics of summer precipitation structure over the Yangtze River Delta[J]. Advances in Water Science, 2022, 33(5): 730-742. (in Chinese)
[22] YUE S, PILON P, PHINNEY B, et al. The influence of autocorrelation on the ability to detect trend in hydrological series[J]. Hydrological Processes, 2002, 16(9): 1807-1829. doi: 10.1002/hyp.1095
[23] WANG Y F, XU Y P, TABARI H, et al. Innovative trend analysis of annual and seasonal rainfall in the Yangtze River Delta, Eastern China[J]. Atmospheric Research, 2020, 231: 104673. doi: 10.1016/j.atmosres.2019.104673
[24] 王杰, 许有鹏, 王跃峰, 等. 平原河网地区人类活动对降雨-水位关系的影响: 以太湖流域杭嘉湖地区为例[J]. 湖泊科学,2019,31(3):779-787. (WANG Jie, XU Youpeng, WANG Yuefeng, et al. Impacts of anthropogenic activity on the response of water level to rainfall in the urbanized plain river network: a case study in the Hangzhou-Jiaxing-Huzhou region of Taihu Basin[J]. Journal of Lake Sciences, 2019, 31(3): 779-787. (in Chinese) doi: 10.18307/2019.0316 WANG Jie, XU Youpeng, WANG Yuefeng, et al. Impacts of anthropogenic activity on the response of water level to rainfall in the urbanized plain river network: a case study in the Hangzhou-Jiaxing-Huzhou region of Taihu Basin[J]. Journal of Lake Sciences, 2019, 31(3): 779-787. (in Chinese) doi: 10.18307/2019.0316
[25] 陆琛莉, 范柏松, 朱莲芳. 环太湖地区汛期降水量与太湖水位的关系[J]. 气象科学,2000,20(1):51-56. (LU Chenli, FAN Baisong, ZHU Lianfang. Relation between precipitation around Taihu in the flood season and Taihu water level[J]. Scientia Meteorologica Sinica, 2000, 20(1): 51-56. (in Chinese) LU Chenli, FAN Baisong, ZHU Lianfang. Relation between precipitation around Taihu in the flood season and Taihu water level[J]. Scientia Meteorologica Sinica, 2000, 20(1): 51-56. (in Chinese)
[26] 徐羽. 城镇化下太湖平原水网区水文过程变化特征及驱动机制研究[D]. 南京: 南京大学, 2019. (XU Yu. Research on variation characteristics and driving mechanism of hydrological processes in urbanized watery Taihu Plain[D]. Nanjing: Nanjing University, 2019. (in Chinese) XU Yu. Research on variation characteristics and driving mechanism of hydrological processes in urbanized watery Taihu Plain[D]. Nanjing: Nanjing University, 2019. (in Chinese)
[27] WILLEMS P. Multidecadal oscillatory behaviour of rainfall extremes in Europe[J]. Climatic Change, 2013, 120(4): 931-944. doi: 10.1007/s10584-013-0837-x
[28] ONYUTHA C, WILLEMS P. Spatial and temporal variability of rainfall in the Nile Basin[J]. Hydrology and Earth System Sciences, 2015, 19(5): 2227-2246. doi: 10.5194/hess-19-2227-2015
[29] XU Y, XU Y P, WANG Q. Evolution trends in water levels and their causes in the Taihu Basin, China[J]. Hydrological Sciences Journal, 2020, 65(13): 2296-2308. doi: 10.1080/02626667.2020.1802026
[30] SADEGH M, RAGNO E, AGHAKOUCHAK A. Multivariate Copula Analysis Toolbox (MvCAT): describing dependence and underlying uncertainty using a Bayesian framework[J]. Water Resources Research, 2017, 53(6): 5166-5183. doi: 10.1002/2016WR020242
[31] SADEGH M, MOFTAKHARI H, GUPTA H V, et al. Multihazard scenarios for analysis of compound extreme events[J]. Geophysical Research Letters, 2018, 45(11): 5470-5480. doi: 10.1029/2018GL077317
[32] 闫宝伟, 郭生练, 陈璐, 等. 长江和清江洪水遭遇风险分析[J]. 水利学报,2010,41(5):553-559. (YAN Baowei, GUO Shenglian, CHEN Lu, et al. Flood encountering risk analysis for the Yangtze River and Qingjiang River[J]. Journal of Hydraulic Engineering, 2010, 41(5): 553-559. (in Chinese) YAN Baowei, GUO Shenglian, CHEN Lu, et al. Flood encountering risk analysis for the Yangtze River and Qingjiang River[J]. Journal of Hydraulic Engineering, 2010, 41(5): 553-559. (in Chinese)
[33] 李艳玲, 畅建霞, 黄强, 等. 基于滑动Copula函数的降水和径流关系变异诊断[J]. 水力发电学报,2014,33(6):20-24, 60. (LI Yanling, CHANG Jianxia, HUANG Qiang, et al. Diagnosis of abrupt changes in precipitation and runoff relation based on sliding Copula function[J]. Journal of Hydroelectric Engineering, 2014, 33(6): 20-24, 60. (in Chinese) LI Yanling, CHANG Jianxia, HUANG Qiang, et al. Diagnosis of abrupt changes in precipitation and runoff relation based on sliding Copula function[J]. Journal of Hydroelectric Engineering, 2014, 33(6): 20-24, 60. (in Chinese)
[34] 郭爱军, 黄强, 王义民, 等. 基于Archimedean Copula函数的流域降雨-径流关系变异分析[J]. 水力发电学报,2015,34(6):7-13. (GUO Aijun, HUANG Qiang, WANG Yimin, et al. Detection of variations in precipitation-runoff relationship based on Archimedean Copula[J]. Journal of Hydroelectric Engineering, 2015, 34(6): 7-13. (in Chinese) GUO Aijun, HUANG Qiang, WANG Yimin, et al. Detection of variations in precipitation-runoff relationship based on Archimedean Copula[J]. Journal of Hydroelectric Engineering, 2015, 34(6): 7-13. (in Chinese)
[35] XU Y, XU Y P, WANG Y F, et al. Spatial and temporal trends of reference crop evapotranspiration and its influential variables in Yangtze River Delta, eastern China[J]. Theoretical and Applied Climatology, 2017, 130(3/4): 945-958.
-
期刊类型引用(1)
1. 贾本有,黎东洲,杨帆,孙晓明,高瑾瑾,苏琨,毕峥峥,范子武. 大汶河流域2001—2022年暴雨洪水特征及其关系分析. 水利水运工程学报. 2025(01): 76-86 .  本站查看
本站查看
其他类型引用(1)
计量
- 文章访问数: 121
- HTML全文浏览量: 26
- PDF下载量: 44
- 被引次数: 2
