
 Email Alerts
 RSS
RSS
Study on the changes in water and sediment transport in the north passage following the third phase of the Yangtze Estuary deepwater channel project
-
摘要:
基于2010—2021年北槽地形和同步水文资料,分析了长江口深水航道三期工程实施后的水沙输移变化。三期工程完成后,北槽中上段水深整体增大,−8 m等深线的展宽主要发生在2010—2017年,−10 m等深线持续展宽,北槽下段水深变化相对较小。北槽中下段涨落潮平均流速趋势性变化不明显,各水层含沙量大都呈下降趋势,中层水体平均含沙量减小近50%。北槽纵向水沙通量远大于横向通量,自2010年以来,水沙横向通量占比下降。北槽水流净通量表层大、底层小,中下段多年来均存在水通量的垂向环流,即表层水体横向净通量向北,而底层向南。悬沙净通量底层大、表层小,在纵向上,表层水体悬沙净通量指向下游,底层水体规律性较差。在横向上,2015年后,北槽中下段表层水体悬沙净通量大都指向航道北侧,底层水体指向航道南侧,表底层悬沙净通量形成垂向环流。
Abstract:Based on topographic and hydrological data from 2010 to 2021, this study analyzes the changes in water and sediment transport in the North Passage following the implementation of the third phase of the Yangtze Estuary deepwater channel project. Post-completion, the overall water depth of the upper and middle sections of the North Passage increased, with the −8 m contour line widening primarily between 2010 and 2017, and the −10 m contour line continuously expanding. The lower section experienced relatively minor depth changes. The average tidal current velocity in the middle and lower sections showed no significant trend, while the sediment concentration in most water layers decreased, with the average sediment concentration in the middle layer decreasing by nearly 50%. The longitudinal water and sediment flux in the North Passage was significantly higher than the lateral flux, with the proportion of lateral flux decreasing since 2010. The net flux of current in the North Passage was higher in the surface layer and lower in the bottom layer. Over the years, a vertical circulation of water flux has been observed in the middle and lower sections, with net lateral flux moving northward in the surface layer and southward in the bottom layer. The net sediment flux was higher in the bottom layer and lower in the surface layer. Longitudinally, the net sediment flux in the surface layer pointed downstream, while the bottom layer showed less regularity. Laterally, post-2015, the net sediment flux in the surface layer at the middle and lower sections generally pointed to the north side of the channel, while the bottom layer pointed south, forming a vertical circulation pattern with the surface layer.
-
Keywords:
- Yangtze Estuary /
- north passage /
- water and sediment flux /
- deepwater channel /
- circulation
-
长江口深水航道治理工程三期工程于2010年完成,12.5 m水深的航道全线贯通[1]。自三期工程完成以来,航道泥沙回淤量在2012年达到最大;2015年之后航道回淤量明显减小,但回淤部位仍集中于北槽中下段,洪季回淤量占比大[2];近年来,北槽航道泥沙淤积量基本在5 000万m3左右[3]。航道回淤量的减小与流域水沙变化、人类活动等密切相关,三峡水库运行后,长江口来沙量减少达2/3[4-5],使得长江口主要汊道含沙量明显降低,减少了深水航道的泥沙来源;南坝田挡沙堤工程实施后,减少了九段沙方向涨潮越堤泥沙量,同时改善了北槽水流结构,降低了航道回淤量[6-7]。长江口深水航道治理工程三期工程实施完成后的北槽演变研究成果较多[8-10],而水沙变化的研究成果大都聚焦在工程完成后的初期,如刘杰等[11-12]采用2009—2011年水沙资料分析了三期工程后的水沙变化;刘高伟等[13]则采用2006、2013年水文资料分析了北槽中上段的水沙变化。前人在研究长江口深水航道治理工程三期工程实施完成后的北槽水沙问题时,关注较多的是水沙的纵向运动特征,而对水沙横向运动的研究较少,且长江口深水航道治理工程三期工程实施完成后的长序列水沙变化研究成果相对较少。本文聚焦于北槽航道回淤重点部位的北槽中下段河段,采用2010—2021年洪季同步水文测验资料,分析北槽三期工程实施以来的水沙变化,为长江口北槽航道的维护提供支撑。
1. 研究区域概况
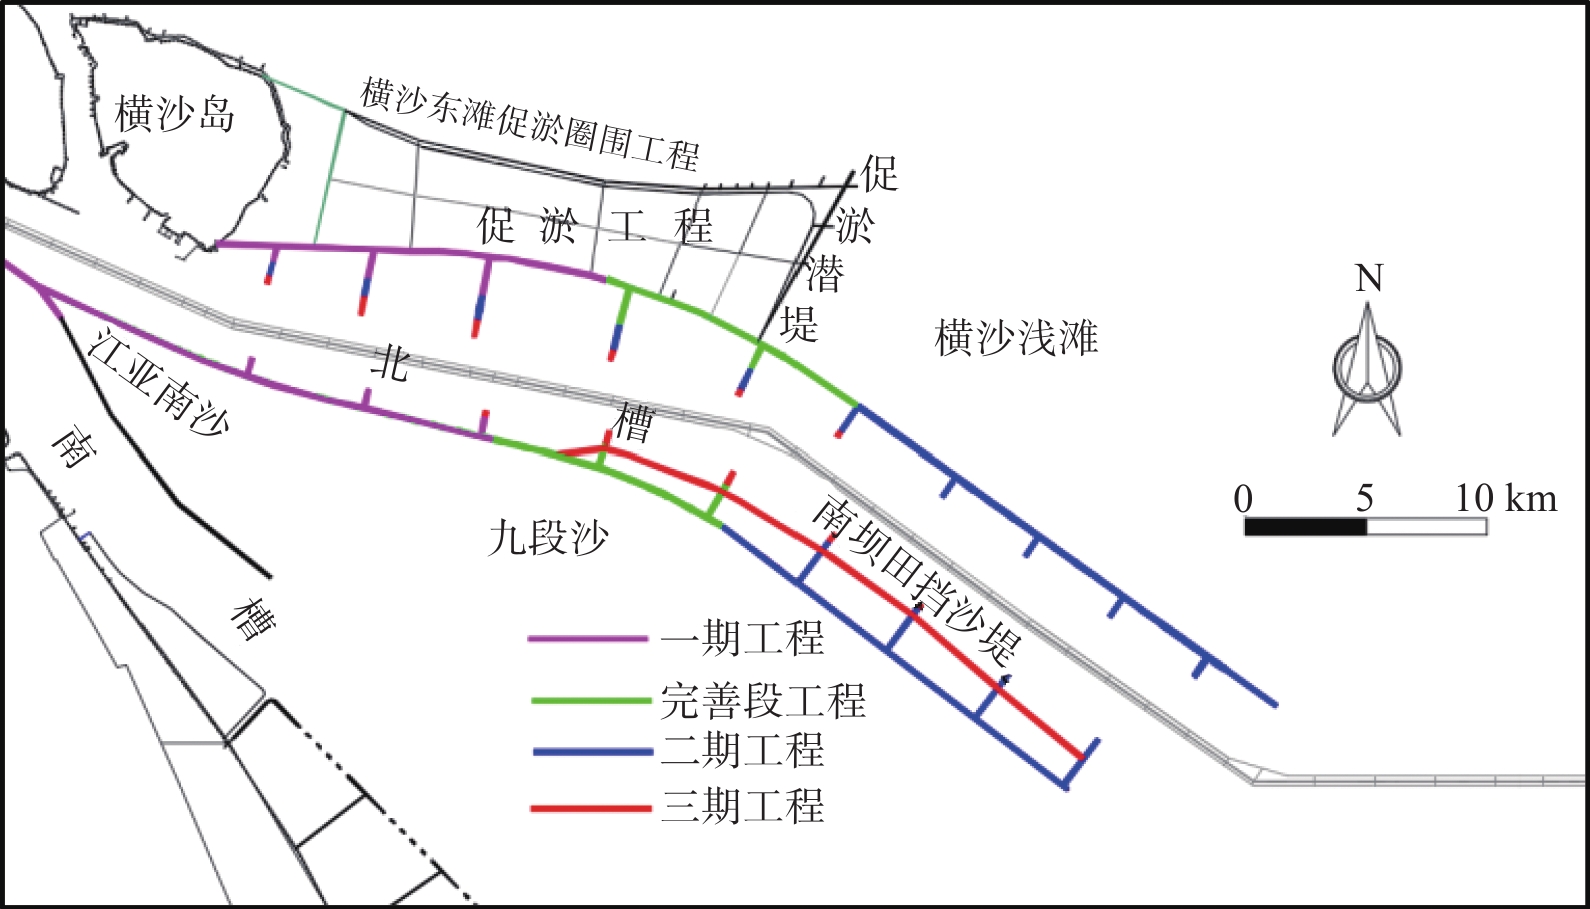
长江口深水航道是长江口航运的咽喉,对长三角地区的发展起着至关重要的作用。长江口深水治理工程自1998年开工,经历一期、完善段、二期和三期工程后,形成了航槽宽350 m,底标高−12.5 m(理论基面)的深水航道(见图1),并于2010年完成竣工验收。2010年长江口深水航道三期工程验收后,由于航道泥沙回淤强度大[2],维护成本高,2016—2019年开展了航道减淤工程,将南坝田挡沙堤加高至高潮位。随着流域来沙的减少,以及周边浅滩的固化,北槽泥沙来源减少,航道泥沙回淤量基本维持在5 000万m3[3]左右。
![]() 图 1 长江口深水航道治理工程布置示意图Figure 1. Schematic diagram of the Yangtze Estuary deepwater channel regulation project layout
图 1 长江口深水航道治理工程布置示意图Figure 1. Schematic diagram of the Yangtze Estuary deepwater channel regulation project layout2. 基础资料与分析方法
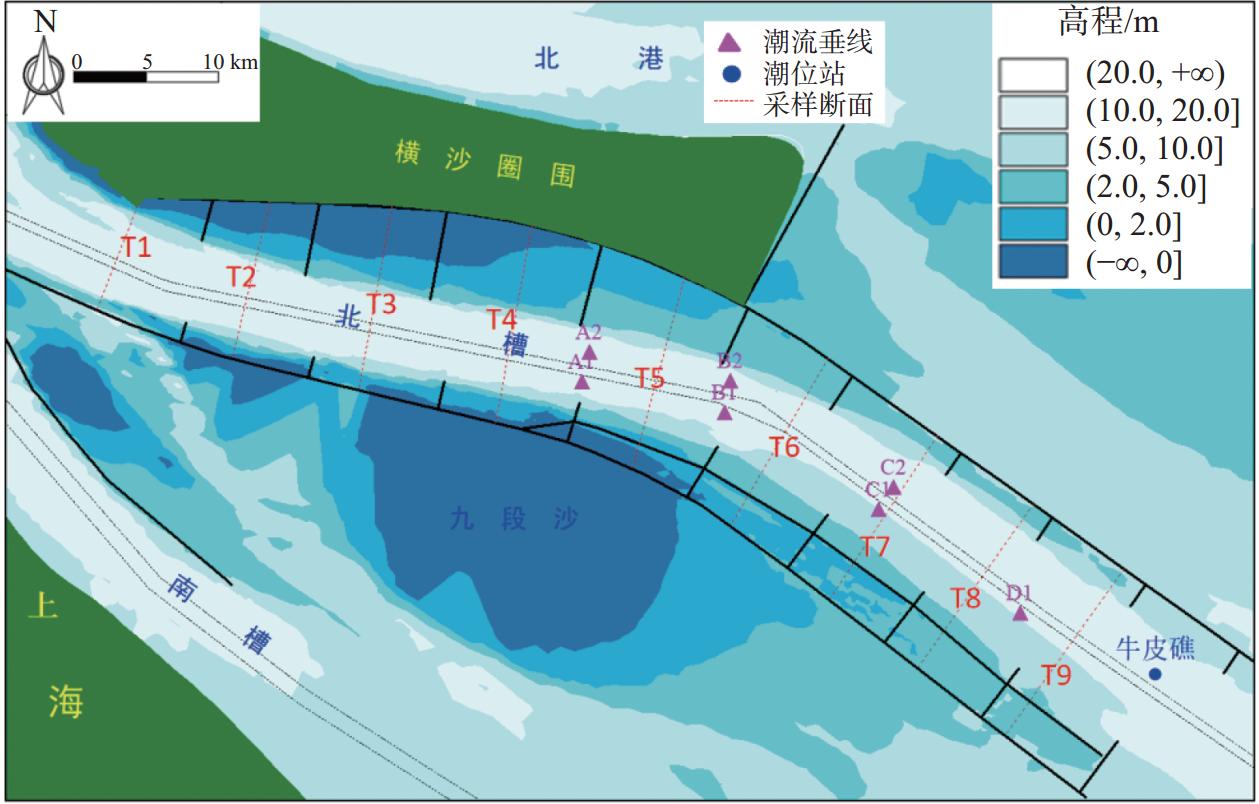
自长江口深水航道治理工程实施以来,北槽水域历年均开展了同步水文测验和地形测量,积累了大量宝贵的水文地形资料。由于长江口北槽深水航道的回淤量主要集中在洪季,因此本文选用2010、2012、2015、2017、2019和2021年由长江口水文水资源勘查局开展的洪季(7—8月)水文测验大潮资料,分析三期工程实施以来的水沙变化,测点分布于航道回淤重点部位的北槽中下段,共7条垂线,均采用6点法测量(位置见图2),不同年份垂线布置数量有所差异(见表1),但各年份相同编号的垂线位置相同,其中A1、B1、C1、D1位于航道南侧,A2、B2、C2位于航道北侧。地形分析资料选取与水文测验对应时间段的地形,比例尺1∶10 000,基面为理论深度基准面。
![]() 图 2 潮流垂线及断面位置示意图Figure 2. Schematic diagram of tidal current vertical lines and cross-section locations表 1 各年份水文测验边界条件及潮流垂线分布Table 1. Boundary conditions and distribution of tidal current vertical lines for hydrological measurements in various years
图 2 潮流垂线及断面位置示意图Figure 2. Schematic diagram of tidal current vertical lines and cross-section locations表 1 各年份水文测验边界条件及潮流垂线分布Table 1. Boundary conditions and distribution of tidal current vertical lines for hydrological measurements in various years年份 测点 水文边界 航南A1 航北A2 航南B1 航北B2 航南C1 航北C2 航南D1 径流/(m3/s) 牛皮礁潮差/m 2010 √ × √ √ √ √ √ 48 000 3.97 2012 √ √ √ √ √ √ √ 54 500 4.47 2015 √ √ √ √ √ √ √ 45 200 4.80 2017 √ √ √ √ √ √ √ 68 624 4.00 2019 √ × √ × √ × √ 52 000 4.29 2021 √ × √ × √ × √ 42 800 4.16 采用等深线对比分析方法分析北槽地形变化,利用不同水层的涨落潮平均流速及含沙量变化来分析北槽水沙输移变化,同时分析不同水层的水沙通量。
北槽水域在深水航道治理工程的约束下,潮流为典型的往复流,但由于潮流与航道轴线方向并不完全一致,因此存在平行(纵向)和垂直(横向)于航道的水沙分量。将各垂线的流速分别沿航道切线和法线方向进行矢量分解,计算1个潮周期内的各方向水沙单宽通量,分析三期工程以来北槽的水沙通量变化。水沙通量计算如下:
$$ Q_\tau=\int_0^{t_1} h v \cos \theta \mathrm{~d} t, \quad W_\tau=\int_0^{t_1} h v \cos \theta s \mathrm{~d} t, \quad Q_\phi=\int_0^{t_1} h v \sin \theta \mathrm{~d} t, \quad W_\phi=\int_0^{t_1} h v \sin \theta s \mathrm{~d} t$$ (1) 式中:$ {Q}_{\mathrm{\tau }} $、$ {Q}_{\mathrm{\phi }} $分别为纵向、横向单宽分层水通量(m3);$ {W}_{\mathrm{\tau }} $、$ {W}_{\mathrm{\phi }} $分别为纵向、横向单宽悬沙通量(kg);$ h $为分层水深(m);$ v $为分层流速(m/s);$ \theta $为流速矢量与航道轴线方向的夹角(°);$ s $为含沙量(kg/m3);$ t $为时间(s);$ t_1 $为潮周期内各方向分量持续时间(s)。
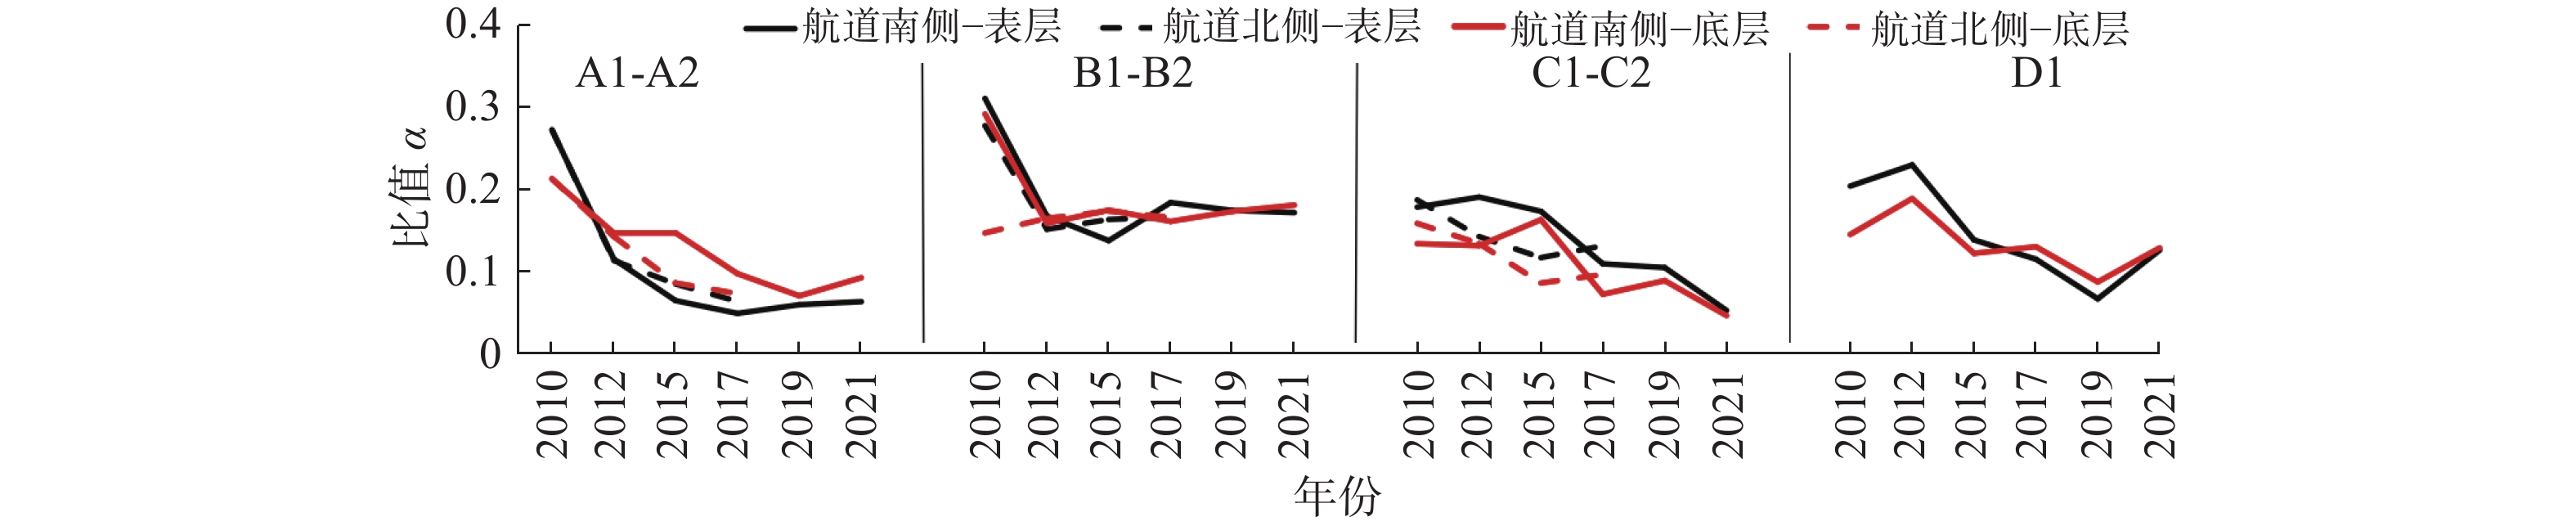
将潮周期内纵(横)向水沙通量进行矢量求和,则得到纵(横)向水沙净通量。以$ \alpha $代表1个大潮周期航道轴线方向水沙横向通量和纵横向总量的比值,即$ \alpha ={|{Q}_{\mathrm{\phi }}|}/({|{Q}_{\mathrm{\phi }}|+|{Q}_{\mathrm{\tau }}|}) $或$ \alpha=|W_{\mathrm{\phi}}|/(|W_{\mathrm{\phi}}|+|W_{\mathrm{\tau}}|) $,通过$ \alpha $值分析北槽横向水沙通量的占比,判断北槽三期工程后的水沙运动趋势变化。
3. 结果与讨论
3.1 河床地形变化
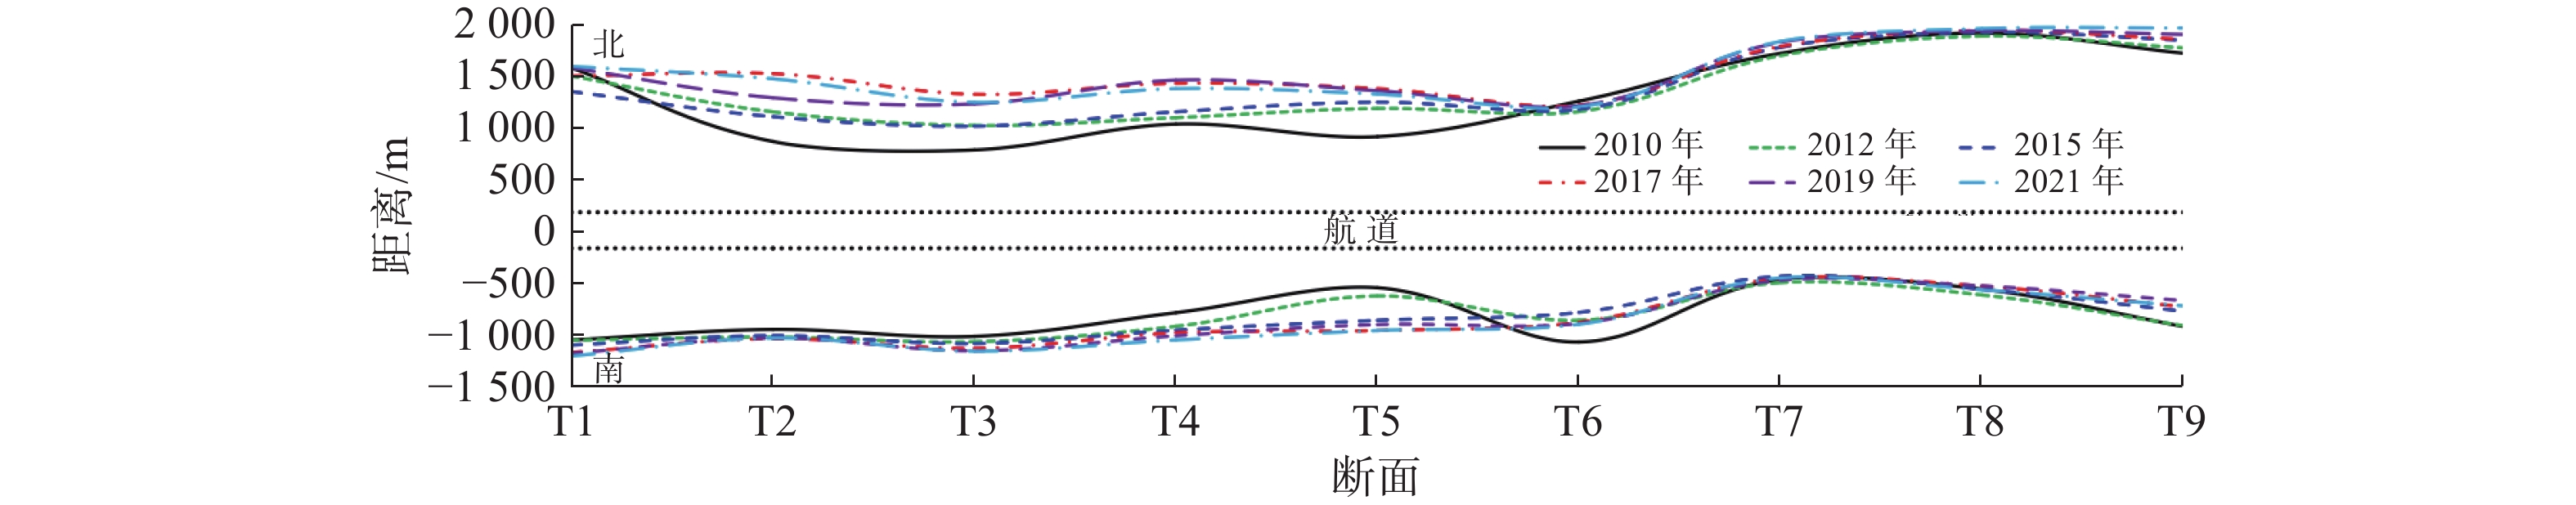
长江口深水航道治理工程三期工程完成后,北槽中上段航道南北侧的−8 m等深线距离丁坝坝头较近,距离为200~400 m,北槽下段航道北侧−8 m等深线基本位于丁坝坝头前沿,航道南侧水深较浅,−8 m等深线距离坝头位置较远,距离为1 200~1 300 m。北槽−8 m等深线的变化见图3,采样断面位置见图2。可见北槽中上段−8 m等深线整体呈展宽趋势,2010—2017年间航道北侧展宽较为明显,幅度为300~500 m,航道南侧−8 m等深线亦有展宽,但幅度相对较小,北槽下段−8 m等深线变化相对较小;2017—2021年,北槽−8 m等深线变化相对较小。
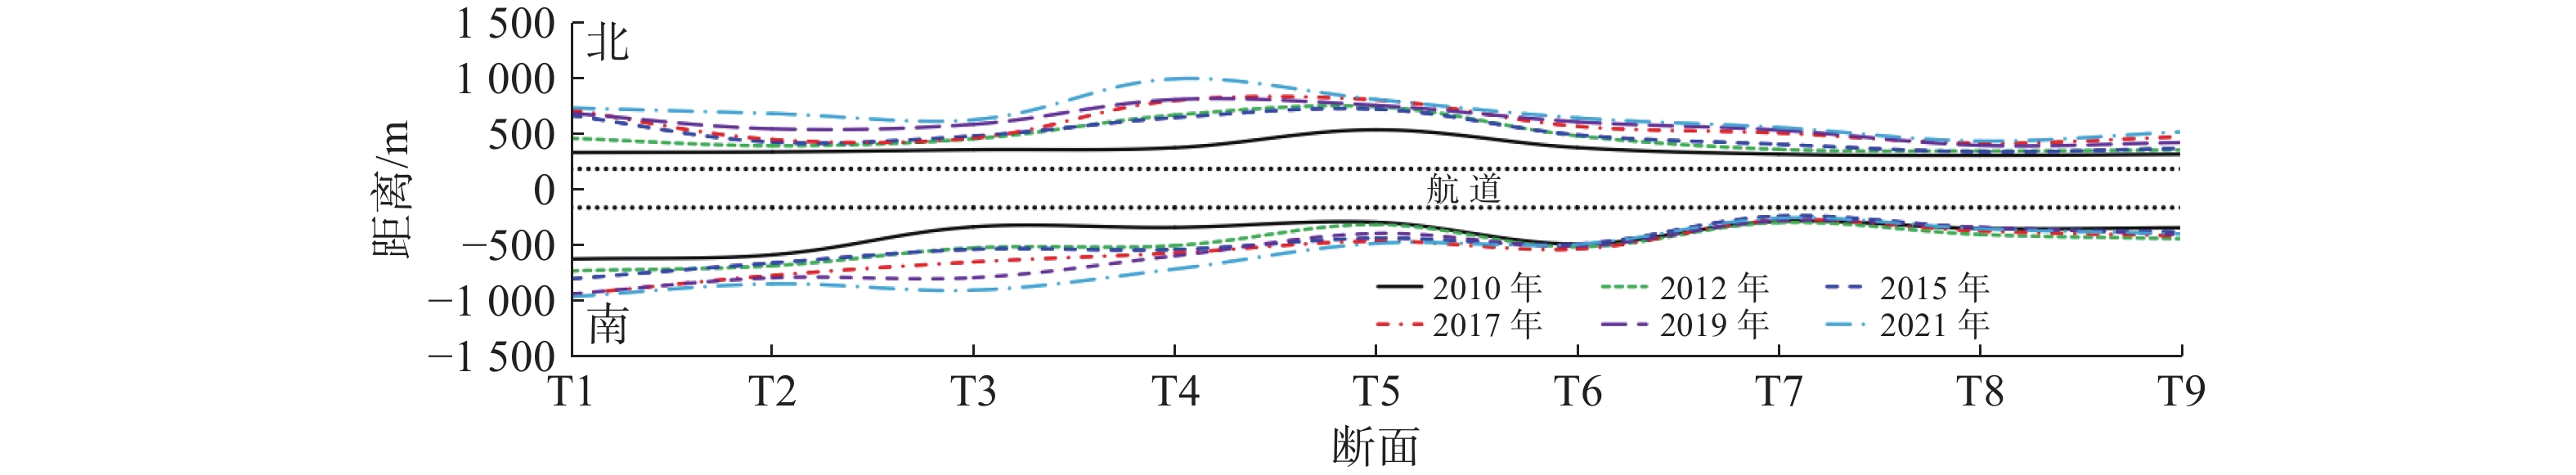
北槽−10 m等深线呈现上段宽下段窄的态势,北槽上段−10 m等深线距离航道边线100~500 m,北槽下段−10 m等深线距离航道边线较近,基本为50~200 m(见图4)。三期工程完成后,2010—2021年,北槽中上段−10 m等深线航道两侧均展宽明显,T1~T5断面,航道北侧平均展宽384 m,航道南侧平均展宽349 m(见图4)。北槽中下段变化相对较小,T6~T9断面,航道北侧平均展宽210 m,航道南侧较小,仅为8 m。
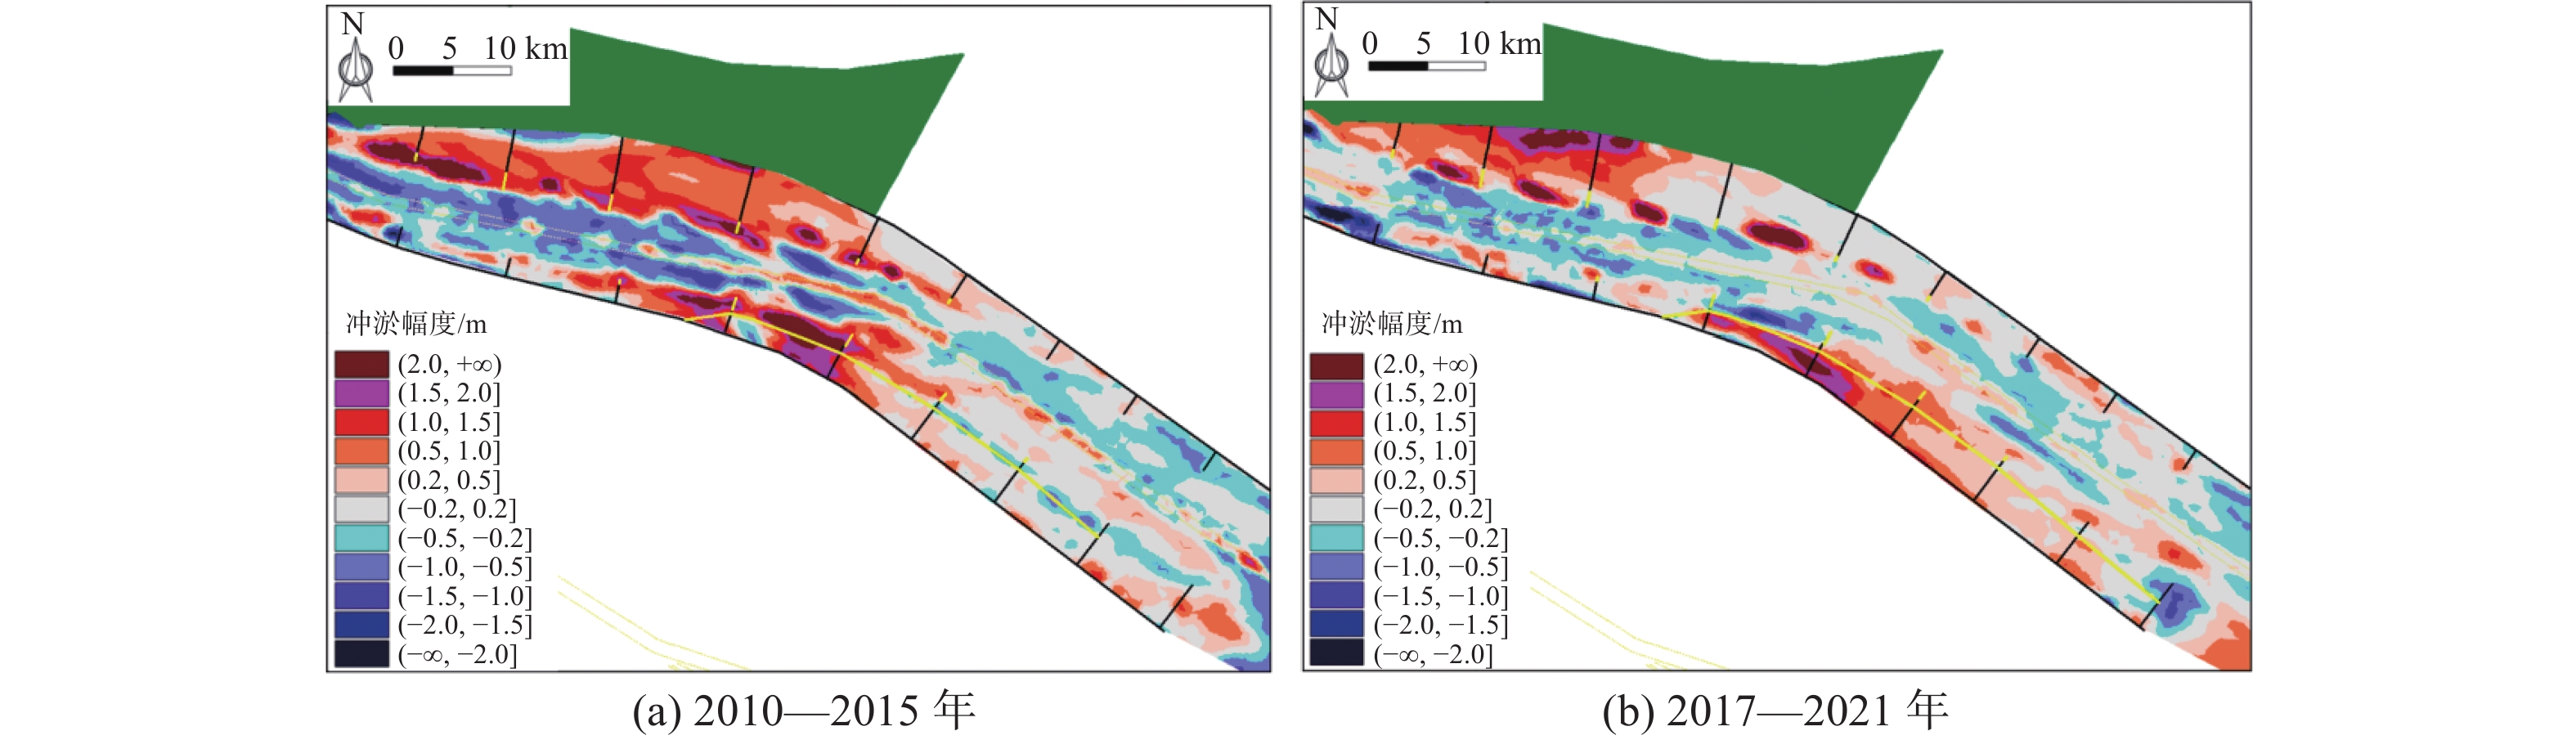
结合图5北槽地形冲淤变化可见,三期工程完成后,北槽中上段河床整体呈冲刷趋势,2010—2015年冲刷幅度明显大于2017—2021年,2010—2015年北槽中上段冲刷基本为0.5~1.5 m,2017—2021年冲刷幅度基本小于0.5 m。北槽中下段航道北侧呈冲刷趋势,2010—2015年、2017—2021年冲刷幅度均小于0.5 m,航道南侧2010—2015年有所淤积,2017—2021年有冲有淤。三期工程完成后,北槽中上段水深变化明显大于中下段,2003年三峡水库蓄水以来,长江口南支、南北港河床普遍冲刷[5],北槽中上段水深的增大除了与整治建筑物有关,还与流域来沙减少有一定的关系。
![]() 图 5 北槽地形冲淤变化(负值为冲刷)Figure 5. Changes in erosion and deposition in the north passage (negative values indicate erosion)
图 5 北槽地形冲淤变化(负值为冲刷)Figure 5. Changes in erosion and deposition in the north passage (negative values indicate erosion)3.2 潮流泥沙变化
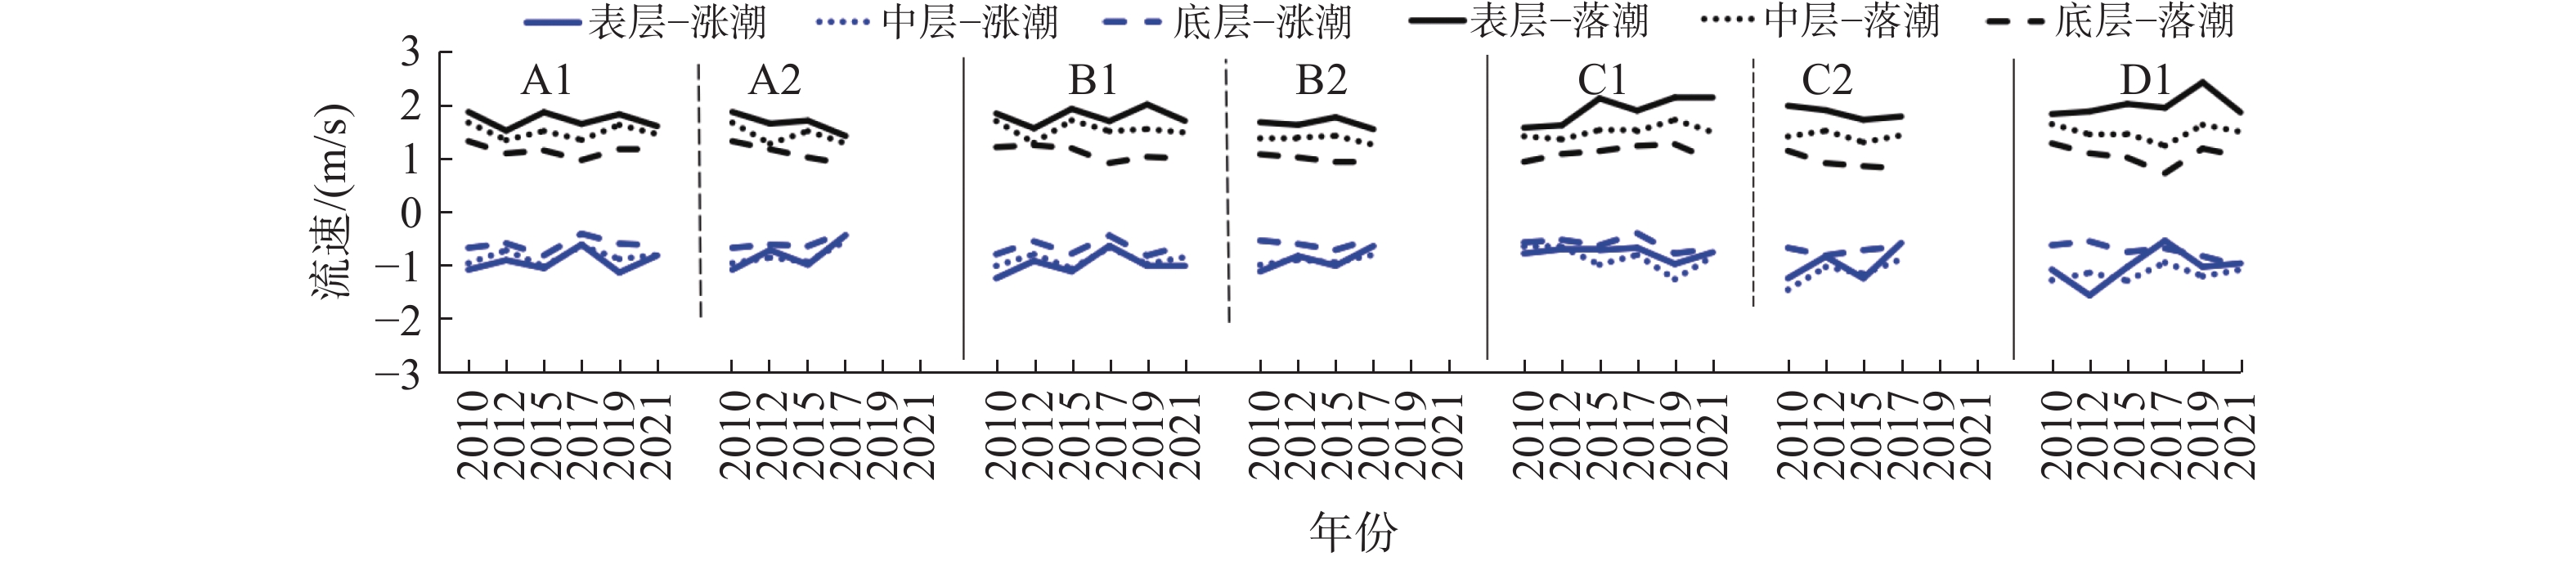
北槽水域位于长江口出海汊道的末端,20世纪90年代以前,北槽水域存在着拦门沙,在深水航道治理工程的作用下,拦门沙消失,但北槽中部依然是最大浑浊带区[14],是北槽航道泥沙回淤最大的区域。图6统计了三期工程完成后的北槽中下段各潮流垂线的涨落潮平均流速变化。由于历次水文测验期间径流和外海潮差的不同,因此不同年份各垂线流速波动较为明显,但不存在趋势性的变化。北槽涨潮期和落潮期流速差异较为明显,由图6可以看出,由于径流对涨潮流存在顶托作用,因此涨潮平均流速明显小于落潮,涨潮时,各垂线表层和中层水体平均流速较为接近,这主要是由于径流的顶托和盐淡水混合造成的密度分层[15]作用,底层水体平均流速最小;落潮时,表层水体流速明显较大,其次为中层,底层流速较小。
![]() 图 6 北槽三期工程后各垂线涨落潮平均流速统计Figure 6. Statistics of average tidal current velocity for each vertical line after the third phase of the north passage project
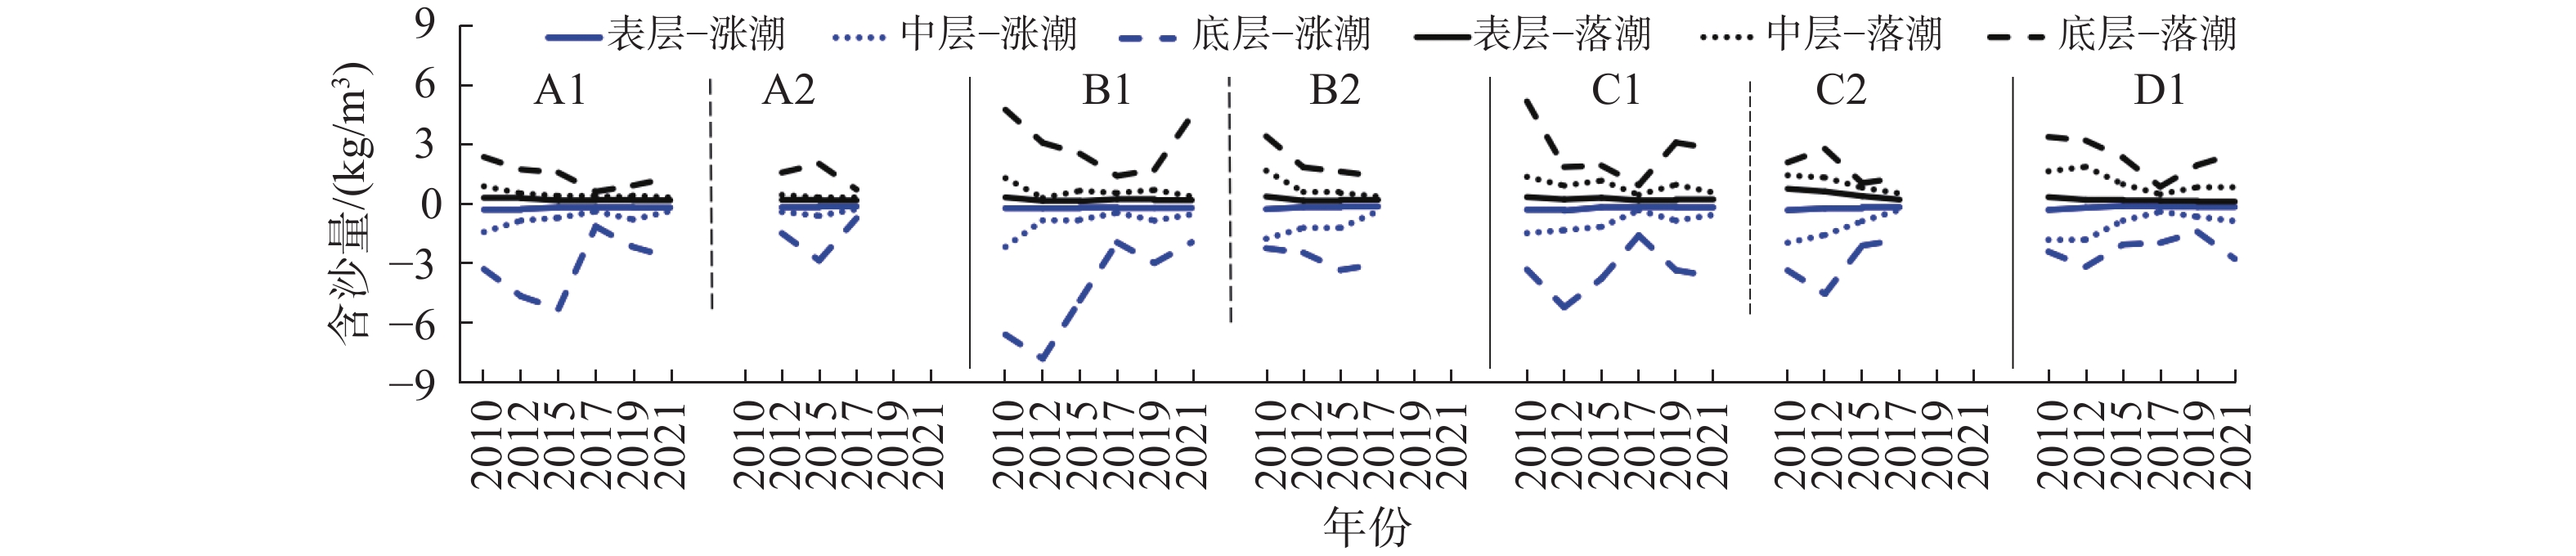
图 6 北槽三期工程后各垂线涨落潮平均流速统计Figure 6. Statistics of average tidal current velocity for each vertical line after the third phase of the north passage project各垂线涨落潮平均含沙量变化如图7所示。可见,北槽表底层含沙量差异较大,表层平均含沙量为0.2~0.3 kg/m3,而底层水体由于水流结构、悬沙沉降、船舶扰动等诸多因素[16]影响,含沙量明显大于表层,平均含沙量最大可达到7.8 kg/m3(2012年)。从涨落潮期看,表层水体涨落潮平均含沙量基本接近,中层和底层平均含沙量总体上涨潮大于落潮。从含沙量变化趋势看,北槽表层含沙量呈现下降趋势,但由于含沙量水平低,降幅较小,自2010年至2021年,大部分测点含沙量减幅小于0.1 kg/m3;中层水体含沙量呈现明显降低趋势,2021年各垂线中层水体平均含沙量为0.4~0.6 kg/m3,相比2010年的1.0~2.0 kg/m3,平均含沙量减幅明显;底层平均含沙量由于影响因素复杂,不同年份数值波动较大,但含沙量总体呈下降趋势,2017—2021年,大部分测点平均含沙量小于2.0 kg/m3,而2010—2015年,平均含沙量大部分垂线超过2.0 kg/m3。
![]() 图 7 北槽三期工程后各垂线涨落潮平均含沙量统计Figure 7. Statistics of average sediment concentration for each vertical line after the third phase of the north passage project
图 7 北槽三期工程后各垂线涨落潮平均含沙量统计Figure 7. Statistics of average sediment concentration for each vertical line after the third phase of the north passage project3.3 水沙通量变化
由图8水流横向通量与纵横向通量之和的占比看,水流的横向通量远小于纵向,A(A1、A2下同)和B(B1、B2下同)点2010年时水流横向通量的占比最大,占总量的20%~35%,2012年A、B两点水流横向通量的占比下降较大,2015年后较为稳定,A点水流横向通量占总量的5%~10%,B点约占15%。C、D两点水流横向通量占比2012年后总体呈下降趋势,说明流速与航道轴线更加顺直,这与三期工程后的北槽地形调整和南坝田加高工程有关[6]。从表底层的水流横向通量占比看,各垂线变化规律性不明显。从航道南北侧看,各垂线大部分年份航道南侧水流通量横向占比大于北侧。图9为悬沙横向通量与纵横向通量之和的占比分析,悬沙横向通量占比的变化与水流总体较为一致,自2010年以来,大部分垂线悬沙横向通量占比呈下降趋势,近年来悬沙横向通量为纵横向总量的5%~15%。
3.4 水沙净通量变化
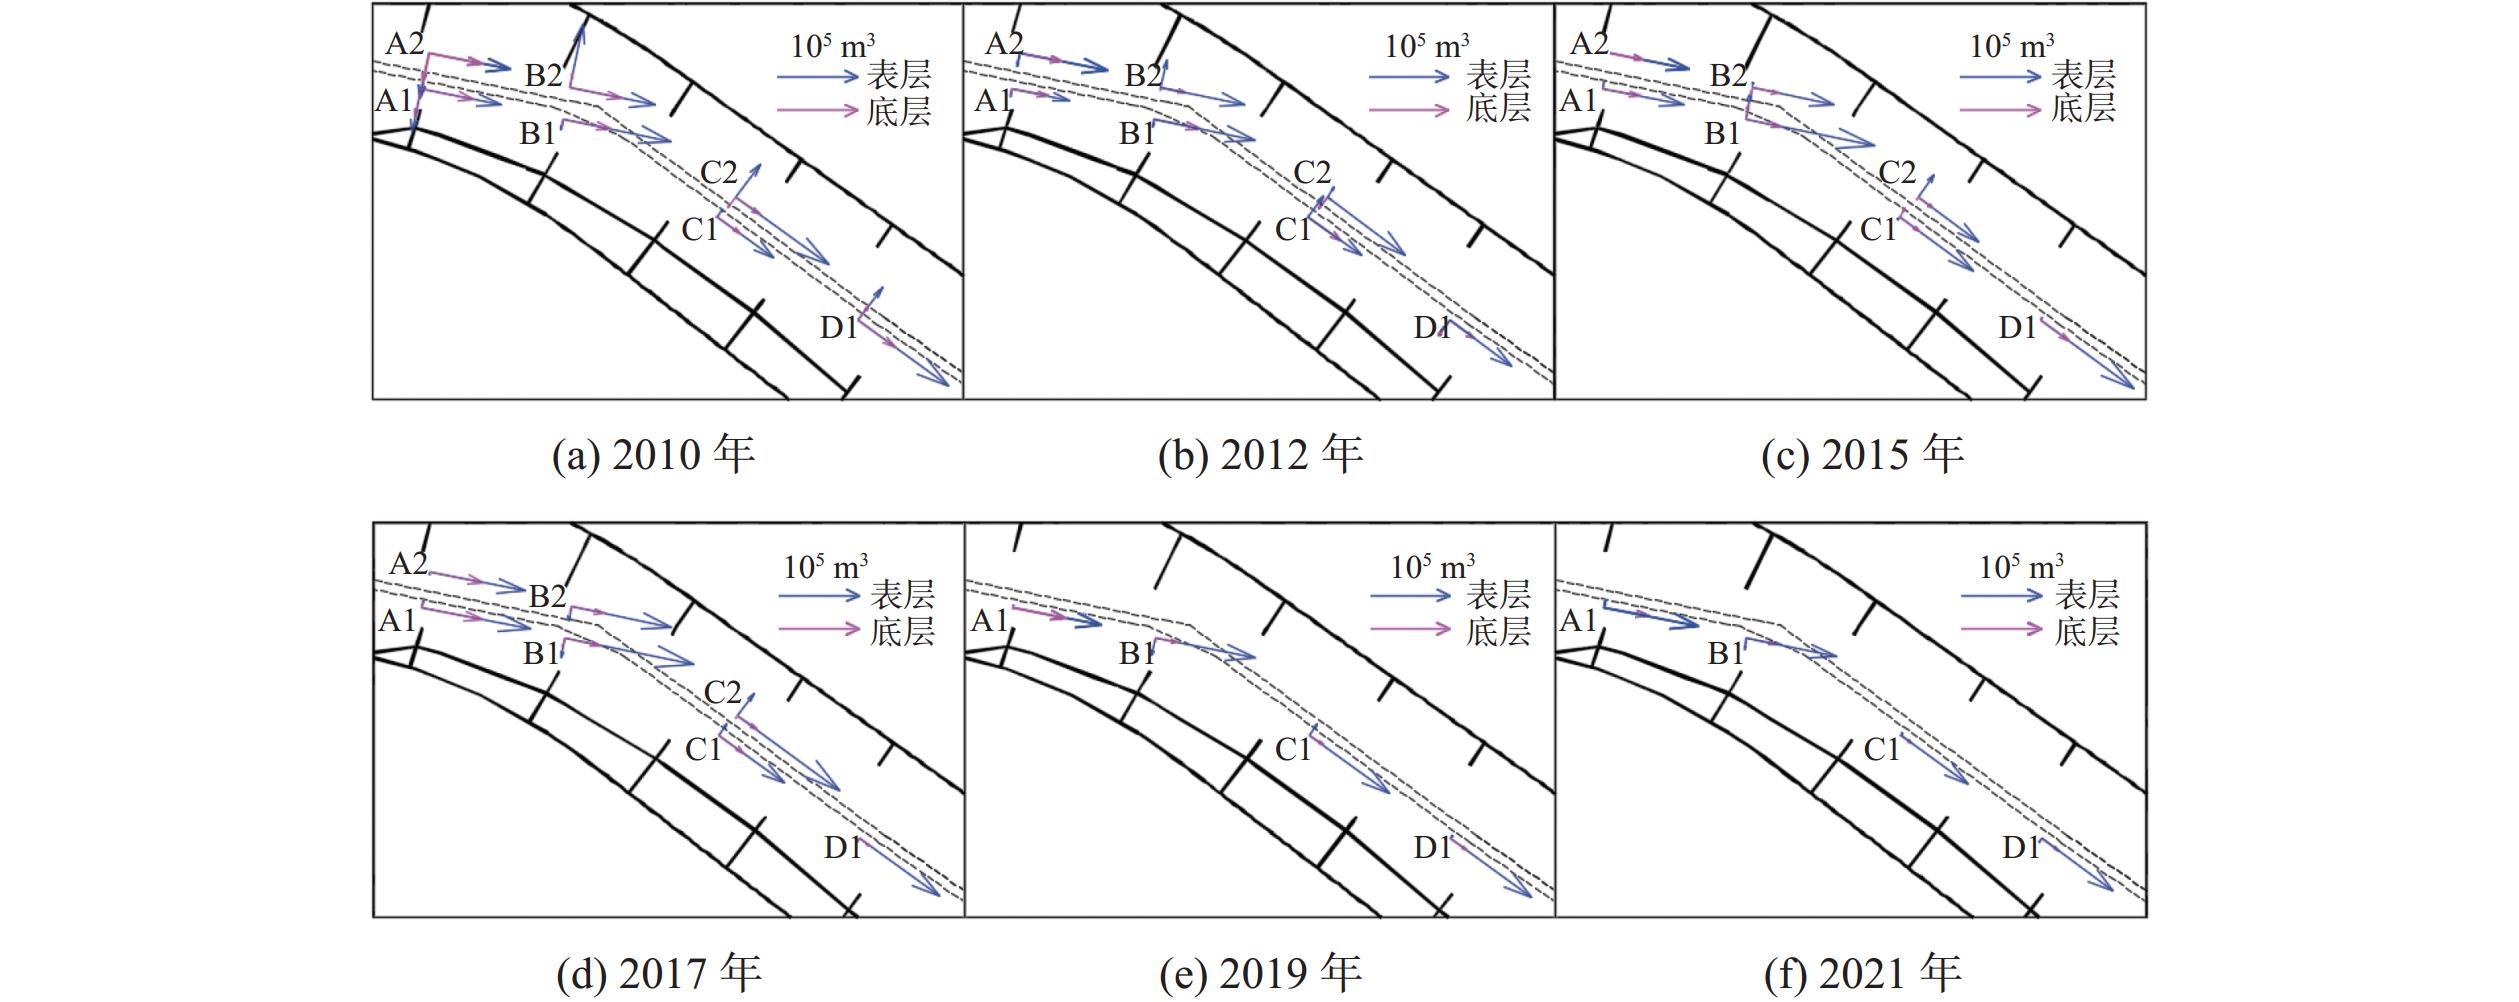
由于水沙通量不同时刻方向不同,因此将不同时间段的水沙纵向和横向通量分别求矢量和,可得到横向和纵向的水沙净通量。图10为北槽三期工程后水流的净通量分布,由于流速在水深方向一般服从对数或三次函数分布[17],因此中上层水体流速相对较大。从图10可以明显看出表层水体的水流净通量大于底层,从整体变化趋势看,水流纵向净通量均指向下游,这主要是径流的作用效果。在横向上,各年份的净通量分布有所差异,主要是北槽中段的A、B点不同年份差异较大,2010—2012年,航道南北侧A1、A2点横向净通量表、底层均指向航道南侧,而B1、B2点则均指向坝田方向;2015—2017年,A、B横向净通量比例明显降低,净通量的方向亦发生改变,A1、A2点净通量均指向航道,B1、B2点2017年均指向航道南侧;2019—2021年,航道南侧的A1、B1点横向净通量方向与2017年相同,未发生改变。北槽中下段的C1、C2和D1垂线,2010—2021年水流横向净通量变化相对较小,其中对于C1、C2点,表层水流横向净通量大都指向航道北侧,而底层则指向航道南侧,形成垂向环流,但从水通量的大小看,表层水体远大于底层水体;D1垂线2010—2021年横向净通量的方向有所波动,规律性不明显。
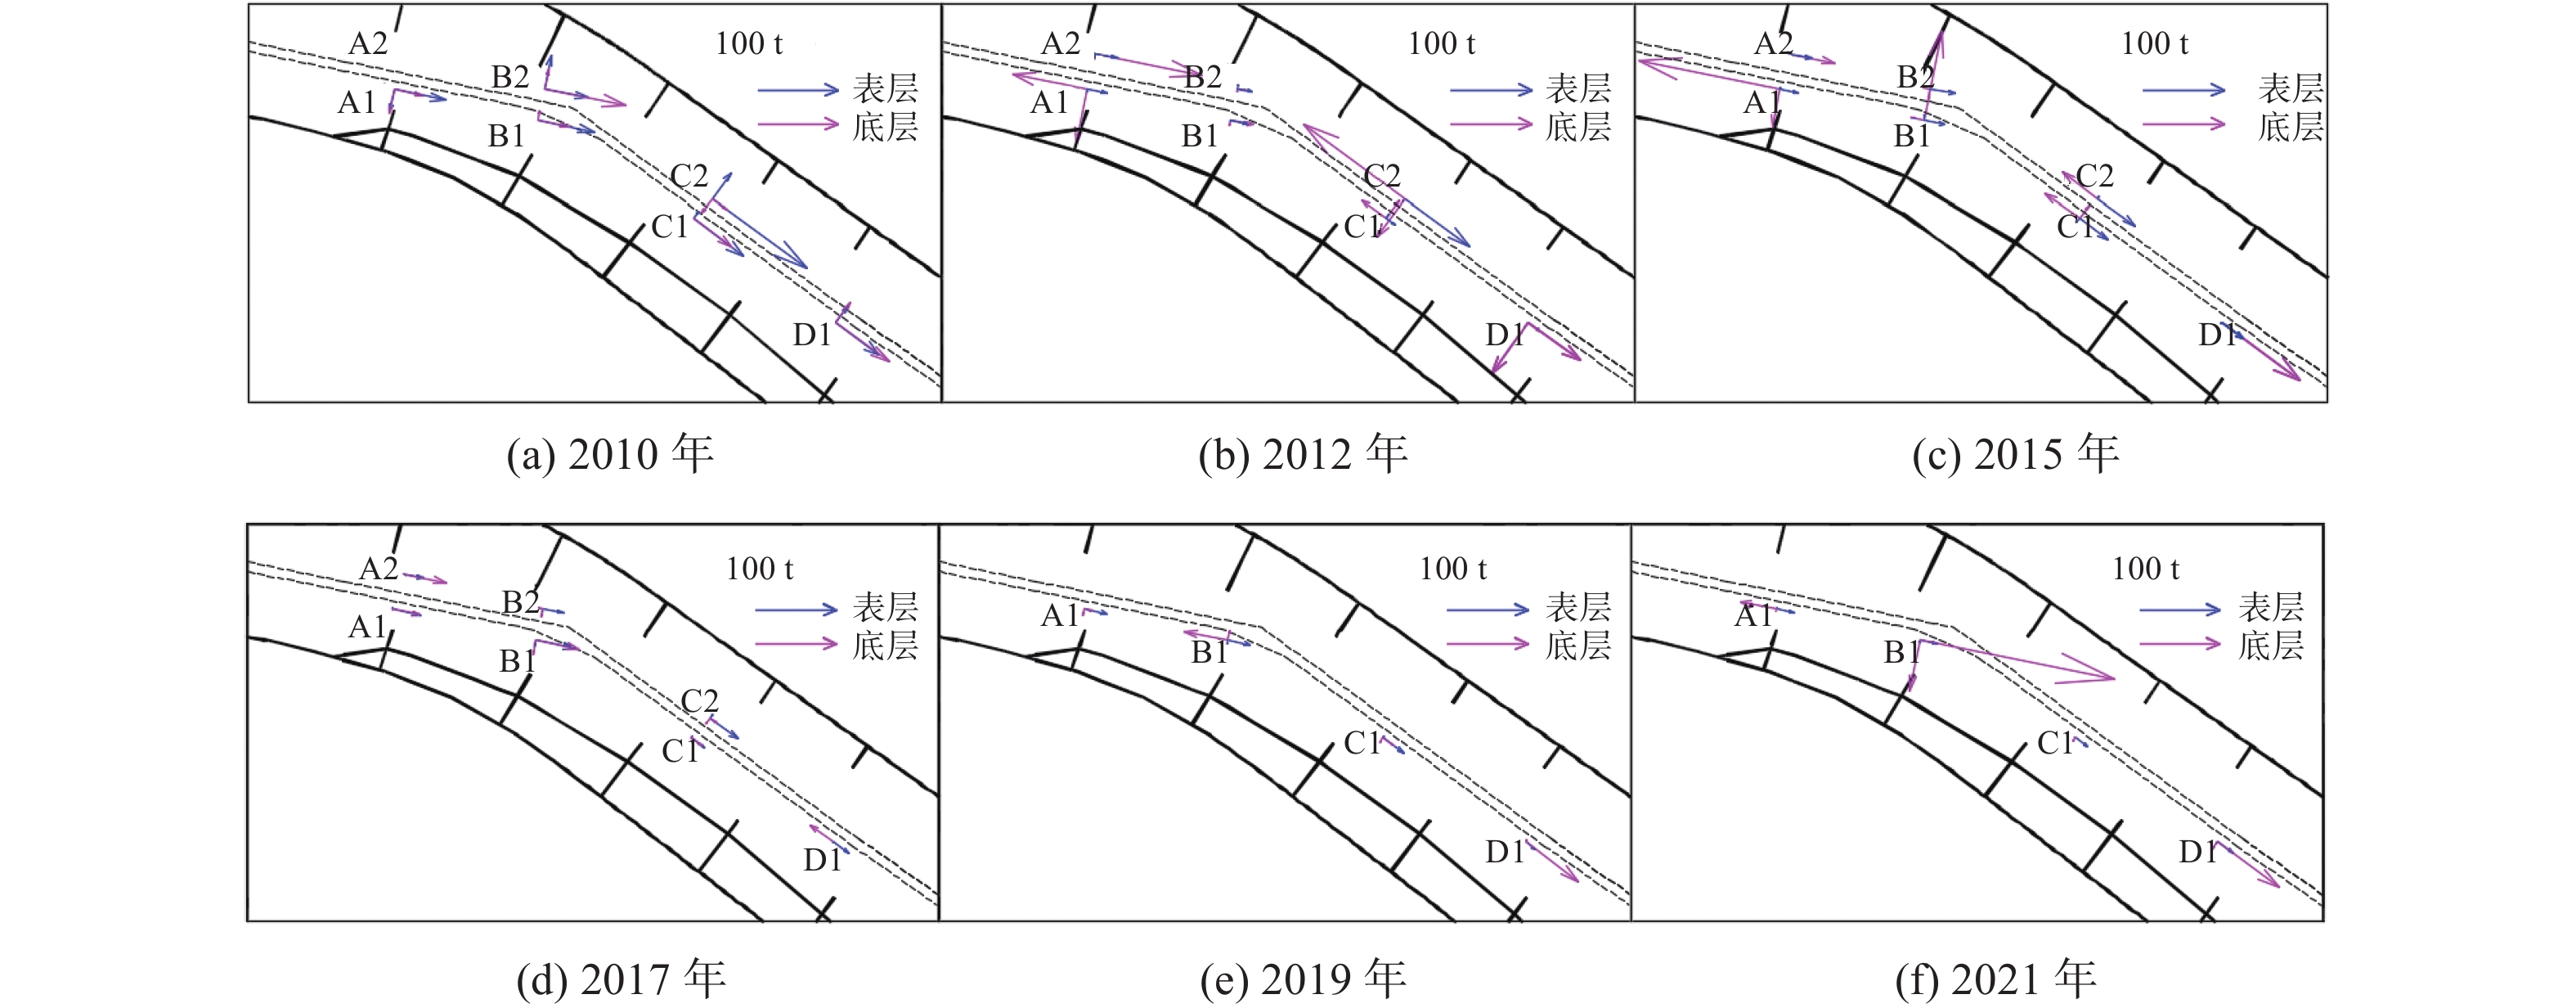
图11及表2~3为北槽三期工程后的悬沙净通量分布,由于悬沙底层含沙量远大于表层(图7),二者存在数量级的差别,因此与水流净通量不同,悬沙净通量底层大多大于表层,受涨落潮含沙量差异的影响,各水层净通量方向差异较大。对于悬沙纵向净通量,表层水体由于含沙量小,且涨落潮差异不大,因此表层水体悬沙纵向净通量均指向下游,底层水体悬沙纵向净通量与表层明显不同,由前文分析知,底层水体涨潮平均含沙量大多大于落潮,因此虽然底层水流纵向净通量指向下游,但由于涨潮平均含沙量大于落潮,因此部分测点悬沙纵向净通量指向上游,如2012年A1、C2点和2021年A1点等。对于悬沙横向净通量,不同垂线差异较大:A1点,2010—2012年表底层悬沙净通量均指向航道南侧,而2015年后,表层水体指向航道北侧,底层水体指向南侧,表底层方向相反;航道北侧的A2点,由于资料较少,悬沙净通量规律性较差;中部的B1点,表层水体悬沙净通量向南为主,底层水体各年份不同,规律性较差;航道北侧的B2点,2010—2012年表层水体悬沙净通量均指向航道北侧,2015—2017年指向南侧,底层水体大部分年份以向南为主;C1点表层水体悬沙净通量大都指向航道北侧,而底层水体在2015年前指向航道北侧,2017年后指向航道南侧,C2点表层水体悬沙净通量向北为主,底层水体向南为主;D1点表底层悬沙净通量方向各年份差异较大,规律性不明显。
![]() 图 11 2010—2021年悬沙净通量分布Figure 11. Distribution of net suspended sediment flux from 2010 to 2021表 2 各垂线表底层航道切向悬沙净通量统计Table 2. Statistics of tangential suspended sediment flux in the surface and bottom layers for each vertical line
图 11 2010—2021年悬沙净通量分布Figure 11. Distribution of net suspended sediment flux from 2010 to 2021表 2 各垂线表底层航道切向悬沙净通量统计Table 2. Statistics of tangential suspended sediment flux in the surface and bottom layers for each vertical line单位:t 年份 A1 A2 B1 B2 C1 C2 D1 表层 底层 表层 底层 表层 底层 表层 底层 表层 底层 表层 底层 表层 底层 2010 64.9 37.5 72.8 40.4 55.4 103.4 78.0 59.0 145.2 23.6 67.2 82.6 2012 25.8 −94.4 28.6 135.5 22.3 28.6 18.5 12.3 13.7 −38.1 100.1 −156.1 18.3 80.0 2015 23.5 −179.2 30.9 60.2 27.2 −16.2 32.4 −9.3 44.4 −52.4 57.7 −54.7 33.3 121.6 2017 35.7 35.3 29.3 59.0 48.7 55.2 26.5 −5.7 20.8 16.0 44.1 9.8 24.1 −35.4 2019 29.3 9.5 28.6 −55.3 32.4 16.3 15.5 83.0 2021 23.1 −46.0 22.7 247.7 18.8 −1.4 24.1 95.1 表 3 各垂线表底层航道法向悬沙净通量统计Table 3. Statistics of normal suspended sediment flux in the surface and bottom layers for each vertical line单位: t 年份 A1 A2 B1 B2 C1 C2 D1 表层 底层 表层 底层 表层 底层 表层 底层 表层 底层 表层 底层 表层 底层 2010 −27.8 −31.1 0.0 12.9 41.9 24.2 11.3 0.0 39.1 −22.0 24.5 31.5 2012 −3.0 −68.1 −3.2 −7.1 −1.1 −7.1 5.2 −4.3 6.7 28.3 −5.0 −59.0 −4.7 −78.4 2015 2.1 −47.3 1.1 1.6 6.1 113.9 −1.2 −14.0 −5.7 20.2 2.8 0.1 −2.6 −2.5 2017 2.0 −1.2 −0.3 −1.0 −7.7 −18.5 −3.7 −10.1 3.1 −1.2 5.5 −8.8 −2.1 0.6 2019 0.5 −7.4 −5.0 13.0 1.9 −6.9 0.5 2.9 2021 2.2 −3.4 −2.8 −64.0 0.2 −4.6 −3.7 −11.2 从以上分析可以看到,水流净通量表层大、底层小,在径流的作用下,水流纵向净通量均指向下游。北槽中段A1、A2点,2010—2012年表底层水流横向净通量指向航道南侧为主,2015年后,净通量方向发生改变,指向航道北侧为主;北槽中下段C1、C2点多年来均存在垂向环流,即表层水流横向净通量向北,而底层向南。悬沙净通量相比水流净通量更为复杂。近年来,由于北槽含沙量的降低,悬沙净通量数值上有减小趋势(见表2~3)。在纵向上,表层水体悬沙净通量均指向下游方向,底层水体由于含沙量大,各年份均存在悬沙净通量指向上游的情况。在横向上,北槽中段A1点,2010—2012年表底层悬沙净通量均指向航道南侧,而2015年后,表层水体悬沙净通量指向航道北侧,底层水体指向南侧,表底层方向相反,中下段C1点表层水体悬沙净通量大都指向航道北侧,而底层水体在2015年前指向航道北侧,2017年后指向航道南侧,C2点表层水体悬沙净通量向北为主,底层水体向南为主,表底层悬沙净通量形成垂线环流。
4. 结 语
根据2010—2021年北槽地形和水沙资料,分析了北槽三期工程实施后的水沙输移变化,得到如下认识:(1)三期工程完成后,北槽中上段水深整体呈现增大趋势,−8 m等深线展宽明显,主要发生在2010—2017年,−10 m等深线持续展宽;北槽下段−8 m等深线变化较小,−10 m等深线航道北侧向北展宽,南侧变化较小。(2)自2010年以来,北槽中下段涨落潮平均流速趋势性变化不明显;北槽涨潮平均含沙量总体大于落潮,表、中、底各水层含沙量大多呈下降趋势,中层水体平均含沙量约减小50%。(3)北槽纵向水沙通量远大于横向,自2010年以来,北槽中下段水沙横向通量占比呈下降趋势,说明水流与航道轴线更加顺直,近年来悬沙横向通量占总量的5%~15%。(4)三期工程完成后,北槽水流纵向净通量变化不大,横向净通量2015年前波动较大,2015年后趋于稳定;北槽中下段(C点)多年来均存在垂向环流,即表层水流横向净通量向北,而底层向南。(5)在纵向上,表层水体悬沙净通量指向下游,底层水体规律性较差。在横向上,2015年后,北槽中下段(B、C点)表层水体悬沙净通量大多指向航道北侧,底层水体指向航道南侧,表底层悬沙净通量形成垂向环流。
-
![]()
图 1 长江口深水航道治理工程布置示意图
Figure 1. Schematic diagram of the Yangtze Estuary deepwater channel regulation project layout
![]()
图 2 潮流垂线及断面位置示意图
Figure 2. Schematic diagram of tidal current vertical lines and cross-section locations
![]()
图 5 北槽地形冲淤变化(负值为冲刷)
Figure 5. Changes in erosion and deposition in the north passage (negative values indicate erosion)
![]()
图 6 北槽三期工程后各垂线涨落潮平均流速统计
Figure 6. Statistics of average tidal current velocity for each vertical line after the third phase of the north passage project
![]()
图 7 北槽三期工程后各垂线涨落潮平均含沙量统计
Figure 7. Statistics of average sediment concentration for each vertical line after the third phase of the north passage project
![]()
图 11 2010—2021年悬沙净通量分布
Figure 11. Distribution of net suspended sediment flux from 2010 to 2021
表 1 各年份水文测验边界条件及潮流垂线分布
Table 1 Boundary conditions and distribution of tidal current vertical lines for hydrological measurements in various years
年份 测点 水文边界 航南A1 航北A2 航南B1 航北B2 航南C1 航北C2 航南D1 径流/(m3/s) 牛皮礁潮差/m 2010 √ × √ √ √ √ √ 48 000 3.97 2012 √ √ √ √ √ √ √ 54 500 4.47 2015 √ √ √ √ √ √ √ 45 200 4.80 2017 √ √ √ √ √ √ √ 68 624 4.00 2019 √ × √ × √ × √ 52 000 4.29 2021 √ × √ × √ × √ 42 800 4.16  下载: 导出CSV
表 2 各垂线表底层航道切向悬沙净通量统计
Table 2 Statistics of tangential suspended sediment flux in the surface and bottom layers for each vertical line
单位:t 年份 A1 A2 B1 B2 C1 C2 D1 表层 底层 表层 底层 表层 底层 表层 底层 表层 底层 表层 底层 表层 底层 2010 64.9 37.5 72.8 40.4 55.4 103.4 78.0 59.0 145.2 23.6 67.2 82.6 2012 25.8 −94.4 28.6 135.5 22.3 28.6 18.5 12.3 13.7 −38.1 100.1 −156.1 18.3 80.0 2015 23.5 −179.2 30.9 60.2 27.2 −16.2 32.4 −9.3 44.4 −52.4 57.7 −54.7 33.3 121.6 2017 35.7 35.3 29.3 59.0 48.7 55.2 26.5 −5.7 20.8 16.0 44.1 9.8 24.1 −35.4 2019 29.3 9.5 28.6 −55.3 32.4 16.3 15.5 83.0 2021 23.1 −46.0 22.7 247.7 18.8 −1.4 24.1 95.1
下载: 导出CSV
表 3 各垂线表底层航道法向悬沙净通量统计
Table 3 Statistics of normal suspended sediment flux in the surface and bottom layers for each vertical line
单位: t 年份 A1 A2 B1 B2 C1 C2 D1 表层 底层 表层 底层 表层 底层 表层 底层 表层 底层 表层 底层 表层 底层 2010 −27.8 −31.1 0.0 12.9 41.9 24.2 11.3 0.0 39.1 −22.0 24.5 31.5 2012 −3.0 −68.1 −3.2 −7.1 −1.1 −7.1 5.2 −4.3 6.7 28.3 −5.0 −59.0 −4.7 −78.4 2015 2.1 −47.3 1.1 1.6 6.1 113.9 −1.2 −14.0 −5.7 20.2 2.8 0.1 −2.6 −2.5 2017 2.0 −1.2 −0.3 −1.0 −7.7 −18.5 −3.7 −10.1 3.1 −1.2 5.5 −8.8 −2.1 0.6 2019 0.5 −7.4 −5.0 13.0 1.9 −6.9 0.5 2.9 2021 2.2 −3.4 −2.8 −64.0 0.2 −4.6 −3.7 −11.2
下载: 导出CSV
-
[1] 张功瑾, 路川藤, 罗小峰, 等. 长江口深水航道治理工程不同阶段北槽丁坝群坝田泥沙冲淤分析[J]. 水运工程,2017(9):121-125, 143. (ZHANG Gongjin, LU Chuanteng, LUO Xiaofeng, et al. Characteristics of sediment erosion and deposition of field between spur dikes at different engineering phases of the Yangtze Estuary deep waterway[J]. Port & Waterway Engineering, 2017(9): 121-125, 143. (in Chinese) ZHANG Gongjin, LU Chuanteng, LUO Xiaofeng, et al. Characteristics of sediment erosion and deposition of field between spur dikes at different engineering phases of the Yangtze Estuary deep waterway[J]. Port & Waterway Engineering, 2017(9): 121-125, 143. (in Chinese)
[2] 刘杰, 程海峰, 韩露, 等. 长江口12.5 m深水航道回淤年际变化及成因[J]. 水科学进展,2019,30(1):65-75. (LIU Jie, CHENG Haifeng, HAN Lu, et al. Interannual variations on siltation of the 12.5 m deepwater navigation channel in Yangtze Estuary[J]. Advances in Water Science, 2019, 30(1): 65-75. (in Chinese) LIU Jie, CHENG Haifeng, HAN Lu, et al. Interannual variations on siltation of the 12.5 m deepwater navigation channel in Yangtze Estuary[J]. Advances in Water Science, 2019, 30(1): 65-75. (in Chinese)
[3] 杨春松, 左书华, 谢华亮, 等. 长江口12.5 m深水航道回淤变化及其影响因素[J]. 水运工程,2022(12):77-83. (YANG Chunsong, ZUO Shuhua, XIE Hualiang, et al. Siltation change and influencing factors of 12.5 m deep-water channel of Yangtze Estuary[J]. Port & Waterway Engineering, 2022(12): 77-83. (in Chinese) YANG Chunsong, ZUO Shuhua, XIE Hualiang, et al. Siltation change and influencing factors of 12.5 m deep-water channel of Yangtze Estuary[J]. Port & Waterway Engineering, 2022(12): 77-83. (in Chinese)
[4] 窦希萍, 缴健, 储鏖, 等. 长江口水沙变化与趋势预测[J]. 海洋工程,2020,38(4):2-10. (DOU Xiping, JIAO Jian, CHU Ao, et al. Review of hydro-sediment change and tendency in Yangtze Estuary[J]. The Ocean Engineering, 2020, 38(4): 2-10. (in Chinese) DOU Xiping, JIAO Jian, CHU Ao, et al. Review of hydro-sediment change and tendency in Yangtze Estuary[J]. The Ocean Engineering, 2020, 38(4): 2-10. (in Chinese)
[5] 韩玉芳, 路川藤. 三峡工程后长江口水沙变化及河床演变特征[C]∥第十九届中国海洋(岸)工程学术讨论会论文集(下). 北京: 海洋出版社, 2019: 773-778. (HAN Yufang, LU Chuanteng. The changes of water and sediment in the Yangtze River Estuary and the characteristics of river bed evolution after the Three Gorges Project[C]∥Collected Papers of the 19th China Marine (Coastal) Engineering Academic Symposium (Part 2). Beijing: China Ocean Press, 2019: 773-778. (in Chinese) HAN Yufang, LU Chuanteng. The changes of water and sediment in the Yangtze River Estuary and the characteristics of river bed evolution after the Three Gorges Project[C]∥Collected Papers of the 19th China Marine (Coastal) Engineering Academic Symposium (Part 2). Beijing: China Ocean Press, 2019: 773-778. (in Chinese)
[6] 付桂, 应铭, 左书华, 等. 长江口深水航道减淤工程实施效果评价[J]. 水运工程,2022(12):134-139, 203. (FU Gui, YING Ming, ZUO Shuhua, et al. Evaluation on effect of silting reduction project in deep-water channel of Yangtze Estuary[J]. Port & Waterway Engineering, 2022(12): 134-139, 203. (in Chinese) FU Gui, YING Ming, ZUO Shuhua, et al. Evaluation on effect of silting reduction project in deep-water channel of Yangtze Estuary[J]. Port & Waterway Engineering, 2022(12): 134-139, 203. (in Chinese)
[7] 应铭, 季岚, 曹慧江, 等. 长江口12.5米深水航道南坝田挡沙堤加高工程总平面方案研究[J]. 海洋工程,2020,38(4):19-28. (YING Ming, JI Lan, CAO Huijiang, et al. The study on general plan layout of the jetty heightening project in the southern groin field of Yangtze Estuary 12.5 m deep-draft waterway[J]. The Ocean Engineering, 2020, 38(4): 19-28. (in Chinese) YING Ming, JI Lan, CAO Huijiang, et al. The study on general plan layout of the jetty heightening project in the southern groin field of Yangtze Estuary 12.5 m deep-draft waterway[J]. The Ocean Engineering, 2020, 38(4): 19-28. (in Chinese)
[8] 唐明. 人工控制下河口分汊河槽演变过程与稳定性研究[D]. 上海: 华东师范大学, 2022. (TANG Ming. Evolution processes and stability of the bifurcated channels in the estuary under human control[D]. Shanghai: East China Normal University, 2022. (in Chinese) TANG Ming. Evolution processes and stability of the bifurcated channels in the estuary under human control[D]. Shanghai: East China Normal University, 2022. (in Chinese)
[9] 简宏康. 人类活动影响下长江口拦门沙近期演变过程及其模拟[D]. 扬州: 扬州大学, 2021. (JIAN Hongkang. Recent evolution and simulation of mouth sandbars in the Yangtze River Estuary under the influence of human activities[D]. Yangzhou: Yangzhou University, 2021. (in Chinese) JIAN Hongkang. Recent evolution and simulation of mouth sandbars in the Yangtze River Estuary under the influence of human activities[D]. Yangzhou: Yangzhou University, 2021. (in Chinese)
[10] 吴帅虎, 程和琴, 郑树伟, 等. 近期长江口北槽河段河槽演变对人类活动的响应[J]. 长江流域资源与环境,2020,29(6):1401-1412. (WU Shuaihu, CHENG Heqin, ZHENG Shuwei, et al. Morphological change of north passage of the Yangtze Estuary in response to human activities[J]. Resources and Environment in the Yangtze Basin, 2020, 29(6): 1401-1412. (in Chinese) WU Shuaihu, CHENG Heqin, ZHENG Shuwei, et al. Morphological change of north passage of the Yangtze Estuary in response to human activities[J]. Resources and Environment in the Yangtze Basin, 2020, 29(6): 1401-1412. (in Chinese)
[11] 刘杰, 郑文燕, 程海峰, 等. 长江口深水航道治理三期工程YH101工程实施效果评价[J]. 浙江水利科技,2014,42(5):22-25. (LIU Jie, ZHENG Wenyan, CHENG Haifeng, et al. The implementation effect of the YH101 project of deepwater navigation channel regulation in Yangtze Estuary[J]. Zhejiang Hydrotechnics, 2014, 42(5): 22-25. (in Chinese) LIU Jie, ZHENG Wenyan, CHENG Haifeng, et al. The implementation effect of the YH101 project of deepwater navigation channel regulation in Yangtze Estuary[J]. Zhejiang Hydrotechnics, 2014, 42(5): 22-25. (in Chinese)
[12] 沈淇, 高钦钦, 顾峰峰, 等. 长江口深水航道三期工程后北槽洪枯季水沙运动特征研究[J]. 海洋学报,2014,36(7):118-124. (SHEN Qi, GAO Qinqin, GU Fengfeng, et al. Analysis of the sediment motion at north passage in flood and dry season after 3rd phase engineering of the deep waterways in Changjiang Estuary[J]. Acta Oceanologica Sinica, 2014, 36(7): 118-124. (in Chinese) SHEN Qi, GAO Qinqin, GU Fengfeng, et al. Analysis of the sediment motion at north passage in flood and dry season after 3rd phase engineering of the deep waterways in Changjiang Estuary[J]. Acta Oceanologica Sinica, 2014, 36(7): 118-124. (in Chinese)
[13] 刘高伟, 程和琴, 杨忠勇. 长江口深水航道三期工程前后北槽中上段水动力及含沙量变化特征[J]. 水利水运工程学报,2015(6):7-16. (LIU Gaowei, CHENG Heqin, YANG Zhongyong. Variations in hydrodynamics and sediment concentration in upper-middle section of north passage before and after the third stage of Yangtze Estuary deepwater channel regulation works[J]. Hydro-Science and Engineering, 2015(6): 7-16. (in Chinese) LIU Gaowei, CHENG Heqin, YANG Zhongyong. Variations in hydrodynamics and sediment concentration in upper-middle section of north passage before and after the third stage of Yangtze Estuary deepwater channel regulation works[J]. Hydro-Science and Engineering, 2015(6): 7-16. (in Chinese)
[14] 张迨. 长江口最大浑浊带水沙特性研究[D]. 上海: 华东师范大学, 2014. (ZHANG Dai. The study on flow and sediment characteristics in the turbidity maximum of Changjiang Estuary[D]. Shanghai: East China Normal University, 2014. (in Chinese) ZHANG Dai. The study on flow and sediment characteristics in the turbidity maximum of Changjiang Estuary[D]. Shanghai: East China Normal University, 2014. (in Chinese)
[15] 高敏, 李占海, 张国安, 等. 长江河口北槽近期盐淡水混合与悬沙输运研究[J]. 人民长江,2017,48(14):12-18. (GAO Min, LI Zhanhai, ZHANG Guoan, et al. Study on salt-fresh water mixing and suspended-sediment transportation at North passage of Yangtze River Estuary[J]. Yangtze River, 2017, 48(14): 12-18. (in Chinese) GAO Min, LI Zhanhai, ZHANG Guoan, et al. Study on salt-fresh water mixing and suspended-sediment transportation at North passage of Yangtze River Estuary[J]. Yangtze River, 2017, 48(14): 12-18. (in Chinese)
[16] 柯科腾, 葛建忠, 丁平兴. 长江口北槽近底高质量浓度泥沙形成关键机制分析[J]. 海洋科学进展,2018,36(4):560-569. (KE Keteng, GE Jianzhong, DING Pingxing. Analysis on key mechanisms of formation of near-bed high-concentration sediment suspension within the north passage of the Changjiang Estuary[J]. Advances in Marine Science, 2018, 36(4): 560-569. (in Chinese) KE Keteng, GE Jianzhong, DING Pingxing. Analysis on key mechanisms of formation of near-bed high-concentration sediment suspension within the north passage of the Changjiang Estuary[J]. Advances in Marine Science, 2018, 36(4): 560-569. (in Chinese)
[17] 贺丙举, 郝嘉凌. 长江口水流流速垂向分布分形研究[J]. 水电能源科学,2015,33(12):37-39, 31. (HE Bingju, HAO Jialing. Fractal study of vertical flow velocity distribution of Yangtze River Estuary[J]. Water Resources and Power, 2015, 33(12): 37-39, 31. (in Chinese) HE Bingju, HAO Jialing. Fractal study of vertical flow velocity distribution of Yangtze River Estuary[J]. Water Resources and Power, 2015, 33(12): 37-39, 31. (in Chinese)

计量
- 文章访问数: 125
- HTML全文浏览量: 24
- PDF下载量: 81
