
 Email Alerts
 RSS
RSS
Characteristics of heavy rainfall and floods in the Dawen River Basin from 2001 to 2022 and their relationship analysis
-
摘要:
科学认识流域实际发生暴雨洪水特征,总结洪水特征及其对致洪暴雨特征响应关系和产汇流规律,对流域洪水精准精细模拟与预报具有重要意义。以大汶河流域为研究区域,基于2001—2022年实测降雨洪水时间序列资料,整理了场次暴雨洪水,选取降水空间矩、洪水集中度等指标表征暴雨洪水特征,采用Kendall秩相关分析研究暴雨洪水响应关系,并对流域降水-径流关系进行统计分析。结果表明:(1)大汶河洪水的流域降雨量呈东多西少特征,洪水相应的暴雨事件常覆盖全流域1/3~1/2的面积,暴雨中心多集中在上游大中型水库附近;(2)北支牟汶河子流域洪水总量统计均值大,是大汶河洪水的主要来源,其洪水特征值与致洪暴雨强度呈弱正相关,但与一阶降水空间矩呈负相关,表明子流域内部具有较强的调蓄能力,而南支柴汶河子流域则相反;(3)大汶河流域洪水产流表现为蓄满产流为主、兼有超渗产流的特点,其中大戴区间近22年降雨事件中产流很少,这与其区间特殊的富水性地质条件及灌区引水密切相关,需在流域水文模拟与洪水预报时特别关注。
-
关键词:
- 场次暴雨洪水 /
- Kendall秩相关分析 /
- 降雨径流关系 /
- 产流机制 /
- 大汶河流域
Abstract:Understanding the characteristics of actual heavy rainfall and floods in a river basin, summarizing the characteristics of floods and their response to flood-causing rainfall, and studying the runoff generation and flow rules are of great significance for accurate and detailed simulation and prediction of floods in the basin. Taking the Dawen River Basin as the study area, based on the observed rainfall and flood time series data from 2001 to 2022, the characteristics of episodic heavy rainfall and floods were analyzed. Indicators such as precipitation spatial moments and flood concentration were selected to characterize the characteristics of heavy rainfall and floods. The Kendall rank correlation analysis was used to study the response relationship between heavy rainfall and floods, and the precipitation-runoff relationship in the basin was statistically analyzed. The results show that: (1) The rainfall in the Dawen River Basin exhibits a characteristic of more rainfall in the east and less in the west, and the heavy rainfall events corresponding to floods often cover 1/3 to 1/2 of the entire basin, with the center of heavy rainfall mostly concentrated near large and medium-sized reservoirs in the upper reaches. (2) The total amount of floods in the sub-basin of the North Branch of the Mouwen River is relatively large and is the main source of floods in the Dawen River Basin. The flood characteristics are weakly positively correlated with the intensity of flood-causing rainfall, but negatively correlated with the first-order precipitation spatial moment, indicating that the sub-basin has strong storage capacity. In contrast, the sub-basin of the South Branch of the Chaiwen River shows the opposite trend. (3) The flood runoff in the Dawen River Basin is mainly controlled by storage runoff with some infiltration runoff. In the past 22 years, there has been very little runoff in the Da-Dai section, which is closely related to the special water-rich geological conditions and irrigation water diversion in this section. Therefore, special attention should be paid to this section in hydrological simulation and flood forecasting in the basin.
-
大汶河位于山东省境内,自东向西流入东平湖,出陈山口后注入黄河,是黄河下游5个洪水来源区之一[1-2]。近年来,大汶河洪水事件频发,给下游东平湖带来了极大的防洪压力,如2021年9月下旬至10月上旬受降雨影响,大汶河发生3次洪水过程,并且恰逢黄河下游出现罕见伏秋大汛,受黄河水位顶托影响,东平湖北排出湖通道严重不畅,曾两次超警戒水位运行累计25 d[3-4]。开展大汶河流域暴雨洪水特征及其关系分析研究,特别是近些年实测降水与洪水,有助于揭示流域现状产流机制,为流域水文物理规律模拟、预测预报、防洪调度决策能力提升提供关键依据。
流域暴雨洪水特性与关系,受到众多专家学者的关注和研究,取得了丰硕的成果[5-6]。张春玲等[7]对大汶河大汶口站的历年洪水特性分析认为,大汶口站洪水过程表现为涨洪历时短、洪量大的特点;谢莉等[8]对皇甫川流域暴雨洪水特性进行了分析,认为该流域暴雨具有短历时高强度、笼罩面积小的特点,洪水过程为陡涨陡落,超渗产流是主要形式;宁黛[9]从降雨过程、洪水过程及组成等角度对2021年的呼玛河流域暴雨洪水特性进行了总结;邹嘉福等[10]对昆明城区及城郊1971—2011年暴雨洪水进行分析,表明随着昆明城镇化发展,城区暴雨具有明显的高集中度特点;Machado等[11]对4个不同土地利用和土壤类型的小流域降水和径流进行了统计,系统总结了影响产流系数的因素;Hu等[12]采用回归分析与Mann-Kendall检验方法对浦阳江流域的暴雨洪水序列进行了趋势分析,结果表明受气候变化和人类活动影响,暴雨洪水序列呈现下降趋势。现有暴雨洪水特征研究主要集中在实测暴雨与洪水的特征值的统计分析、建模分析等,对二者之间的响应关系与规律研究较少。受气候变化与人类活动共同影响,极端天气事件发生难预见、人类活动干扰能力增强,洪涝灾害风险有增大趋势,突出洪水特征及其致洪暴雨响应关系与规律是本研究重点关注的内容之一。
本研究利用2001—2022年大汶河流域实测降雨与洪水数据,依据洪水过程进行场次暴雨洪水划分,建立一一对应关系,统计历次暴雨的次降水量、时段最大降水量及降雨空间矩,以及洪水总量、洪峰流量等系列洪水特征值。在此基础上,针对大汶河洪水各主要集水单元,采用Kendall秩相关分析法进行暴雨与洪水特征值的关系分析,总结洪水对致洪暴雨的响应关系与规律,并就洪水组成、降水径流关系及产流方式等进行分析总结。
1. 区域概况及数据
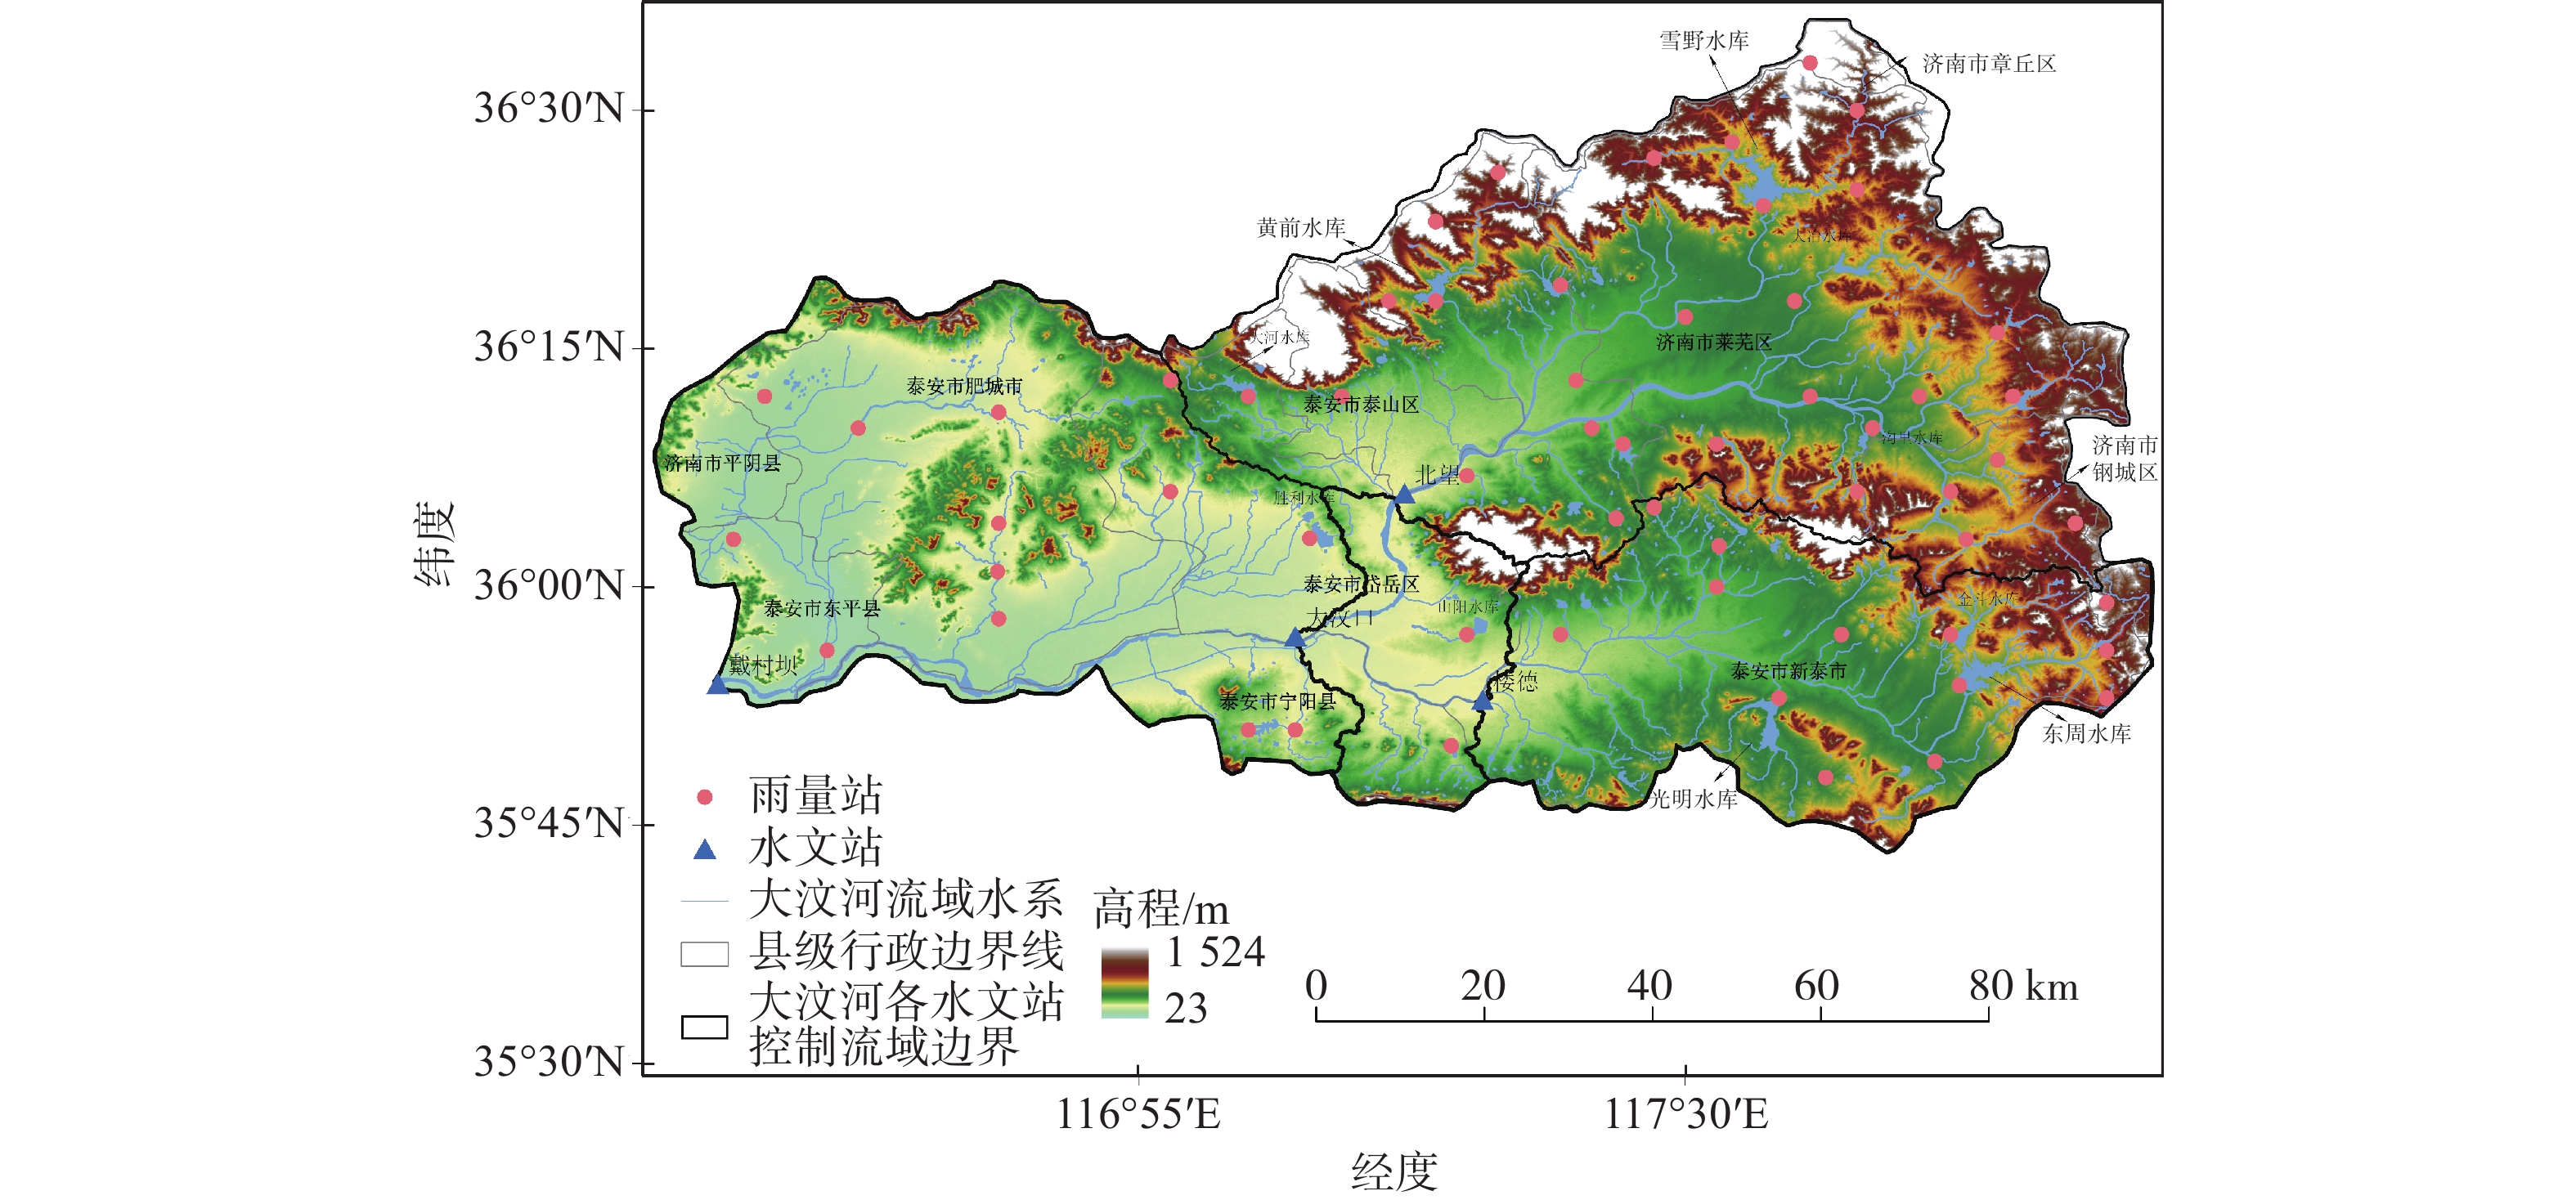
大汶河发源于沂源县悬固山,自东向西流经莱芜、新泰、泰安、肥城等县市,于东平县州城镇马口村汇入东平湖老湖,干流河长209 km。现状大汶河流域指戴村坝水文站以上控制区域,面积约8 264 km2,流域河流水系、雨量站、水文站分布等见图1。流域地势东高西低,北高南低,北有泰山,东靠鲁山、蒙山,西及南边为丘陵和平原,流域内山区和丘陵分别占流域面积的31%和37%。流域属北温带半湿润性气候,降水受季风气候影响,多年平均年降水量为689.6 mm,多集中在6—9月份[13]。流域西部大汶口至戴村坝区间以松散岩类孔隙含水岩组为主,具有较好的富水性,除接受降水补给外,还可以接受地表水及地下径流的补给,而东部大汶口以上区域以岩浆岩类裂隙含水岩组为主,富水性较差,地下水不易存储[14]。
依据流域内控制性水文站点与集水范围,划分为北望控制区、楼德控制区、北望楼德至大汶口区间(简称北楼大区间)及大汶口至戴村坝区间(简称大戴区间)4个水文集水单元(表1),其中北望控制区反映北支牟汶河子流域情况,楼德控制区反映南支柴汶河子流域情况。
表 1 各水文单元水文地理特征统计Table 1. Statistical analysis of hydrological and geographical characteristics of each hydrological unit序号 集水单元 控制站点 单元面积/
km2大中型水库控制
面积/km2高程范围/m 1 北望控制区 北望站 3 551 1 496 111~1 524 2 楼德控制区 楼德站 1 668 468 109~978 3 北楼大区间 大汶口站 477 73 85~1 023 4 大戴区间 戴村坝站 2 568 173 23~612 本研究数据范围为2001—2022年,其中2001—2019年数据来自黄河水文年鉴的降水摘录和洪水要素摘录,涉及霞峰、蒙阴寨、郑王庄等48个雨量站降水量,北望、楼德、大汶口和戴村坝4个水文站的流量;2020—2022年数据来自山东黄河河务局信息中心实时雨水情数据库,涉及龙廷、彩山、岔河等48个雨量站降水量,以及北望、楼德、大汶口和戴村坝4个水文站的流量。
2. 研究方法
选择洪峰流量、洪水总量和洪水集中度作为洪水特征指标。其中,洪水集中度$ D_{\mathrm{c}} $采用式(1)计算[15]:
$$ D_{\mathrm{c}}=\sqrt{\left(\sum_{i=1}^nr_{\mathrm{t},i}\mathrm{s}\mathrm{i}\mathrm{n}\theta_i\right)^2+\left(\sum_{i=1}^nr_{\mathrm{t},i}\mathrm{c}\mathrm{o}\mathrm{s}\theta_i\right)^2}/W $$ (1) 式中:$ {r}_{\mathrm{t},i} $为第$ i $个时段的洪水总量(104 m3),将区间作为一个圆周,每个时段平均分配;$ {\theta }_{i} $为第$ i $个时段对应的方向$ ;W $为场次洪水总量(104 m3)。
选择1、6、24、48 h时段最大降水量、次降水量和降水空间矩指标[16]作为暴雨特征指标。其中,降水空间矩指标包括一阶空间矩$ {\delta }_{1} $和二阶空间矩$ {\delta }_{2} $,是关于暴雨分布和洪水流动距离的函数,暴雨分布的n阶矩和洪水流动距离的n阶矩分别为$ {p}_{n} $和$ {g}_{n} $,计算式[17]为:
$$ {p}_{n}={\left|A\right|}^{-1}\underset{A}{\overset{}{\int }}p\left(x,y\right){l\left(x,y\right)}^{n}\mathrm{d}A $$ (2) $$ {g}_{n}={\left|A\right|}^{-1}\underset{A}{\overset{}{\int }}{l\left(x,y\right)}^{n}\mathrm{d}A $$ (3) 式中:$ A $为流域边界内的空间区域(km2);$ p\left(x,y\right) $为流域内某一位置的次降水量(mm);$ l\left(x,y\right) $为洪水从该位置到流域出口的流动距离(km)。
一阶空间矩$ {\delta }_{1} $和二阶空间矩$ {\delta }_{2} $的计算式如下:
$$ {\delta }_{1}={p}_{1}/\left({p}_{0}{g}_{1}\right) $$ (4) $$ {\delta }_{2}=\left[\frac{{p}_{2}}{{p}_{0}}-{\left(\frac{{p}_{1}}{{p}_{0}}\right)}^{2}\right]/\left({g}_{2}-{g}_{1}^{2}\right) $$ (5) 一阶空间矩$ {\delta }_{1} $可以反映暴雨中心的分布情况,$ {\delta }_{1} $越大,说明暴雨中心越接近流域上游,特别地,$ {\delta }_{1} $=1时,暴雨中心位于流域中心处或流域面上分布均匀。二阶空间矩$ {\delta }_{2} $可以反映暴雨中心的个数,当$ {\delta }_{2} < $1时,说明只有1个暴雨中心;$ {\delta }_{2} $=1时,暴雨在流域面上分布均匀;$ {\delta }_{2} $>1,则说明至少有2个暴雨中心。
Kendall秩相关系数可以反映两个变量之间相互关联的强度和方向[18-19],其值介于-1到1之间,绝对值表示相关强度,绝对值越接近1,两个变量的相关性越强;正负号则表示相关的方向,正号为正相关,负号为负相关。在Kendall秩相关分析中,假设变量X的样本值记为$ {x}_{1} $、$ {x}_{2} $,与之相对应的变量Y的两个样本值分别记为$ {y}_{1} $、$ {y}_{2} $,若$ \left(x_2-x_1\right)\left(y_2-y_1\right) $≥0,则认为两个变量的这一对样本为一致对,反之为分歧对,进而有如下Kendall秩相关系数$ \tau\mathrm{_a} $的计算式:
$$ \tau\mathrm{_a}=\left(c-d\right)/\left[\frac{1}{2}n\left(n-1\right)\right] $$ (6) 式中:$ n $为样本个数;$ c $和$ d $分别为一致对和分歧对的个数。
在洪水特征值次洪总量计算结果的基础上,计算径流深及产流系数,进行降水-径流关系的统计分析,计算式如下:
$$ R=10W/S \text{,} \alpha =R/P $$ (7) 式中:R为径流深(mm);W为次洪总量(104 m3);S为流域面积(km2);P为次降水量(mm);α为产流系数。
3. 结果及分析
3.1 场次洪水特征分析
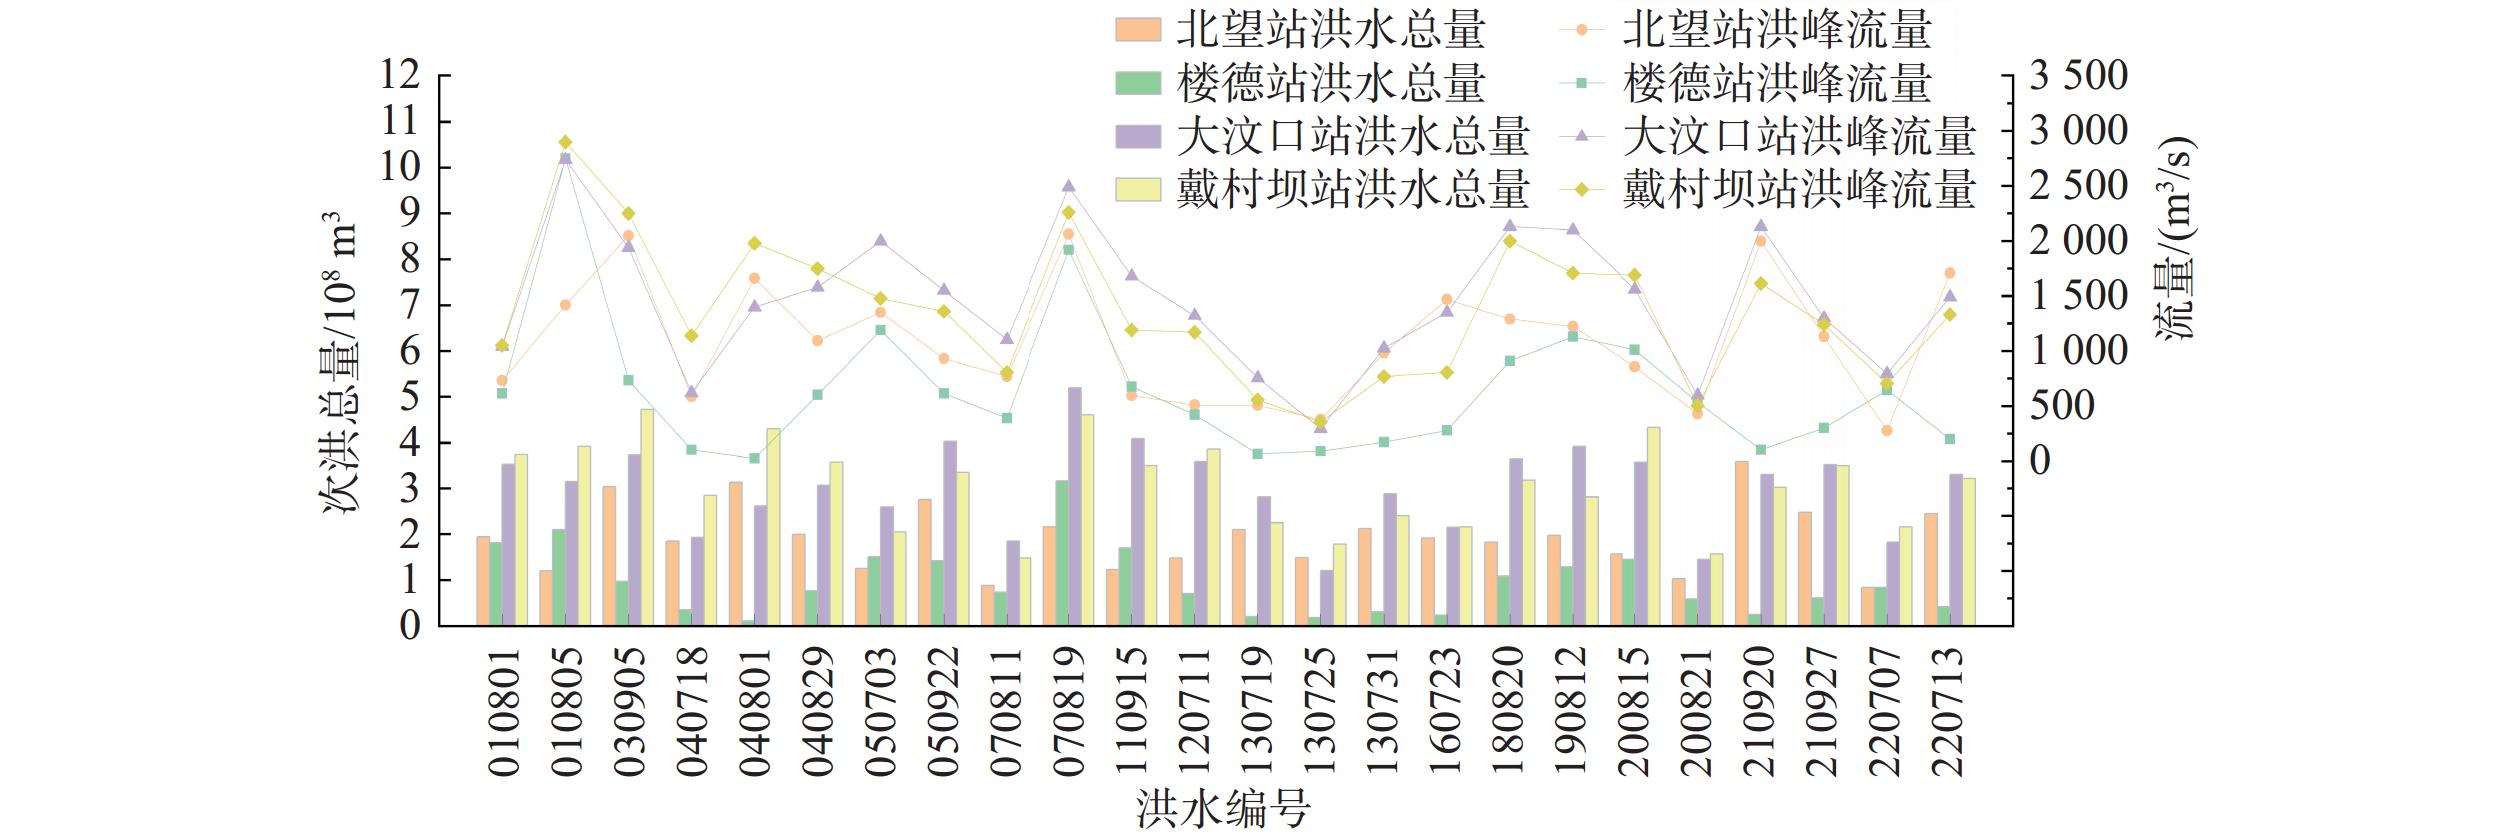
依据大汶河戴村坝站实测洪水时间序列数据,按照500 m3/s洪峰流量阈值,筛选划分出24个场次洪水过程,并将各站资料进行洪水统一编号,各站洪峰流量和洪水总量见图2。从洪水总量统计平均值看,北望站、楼德站分别为1.93亿 m3、0.95亿 m3,这表明北支牟汶河是大汶河洪水主要来源;大汶口站、戴村坝站分别为3.06 亿m3、3.10 亿m3,2005年始甚至出现戴村坝站洪水总量小于大汶口站的情况,表明大汶口至戴村坝区间的产流量少,这与大戴区间以松散岩类孔隙含水岩组为主、具有较好富水性的地质条件及中小洪水条件下灌区引水密切相关。
![]() 图 2 大汶河流域各站历次洪水特征值Figure 2. Characteristics of historical floods at various stations in the Dawen River Basin
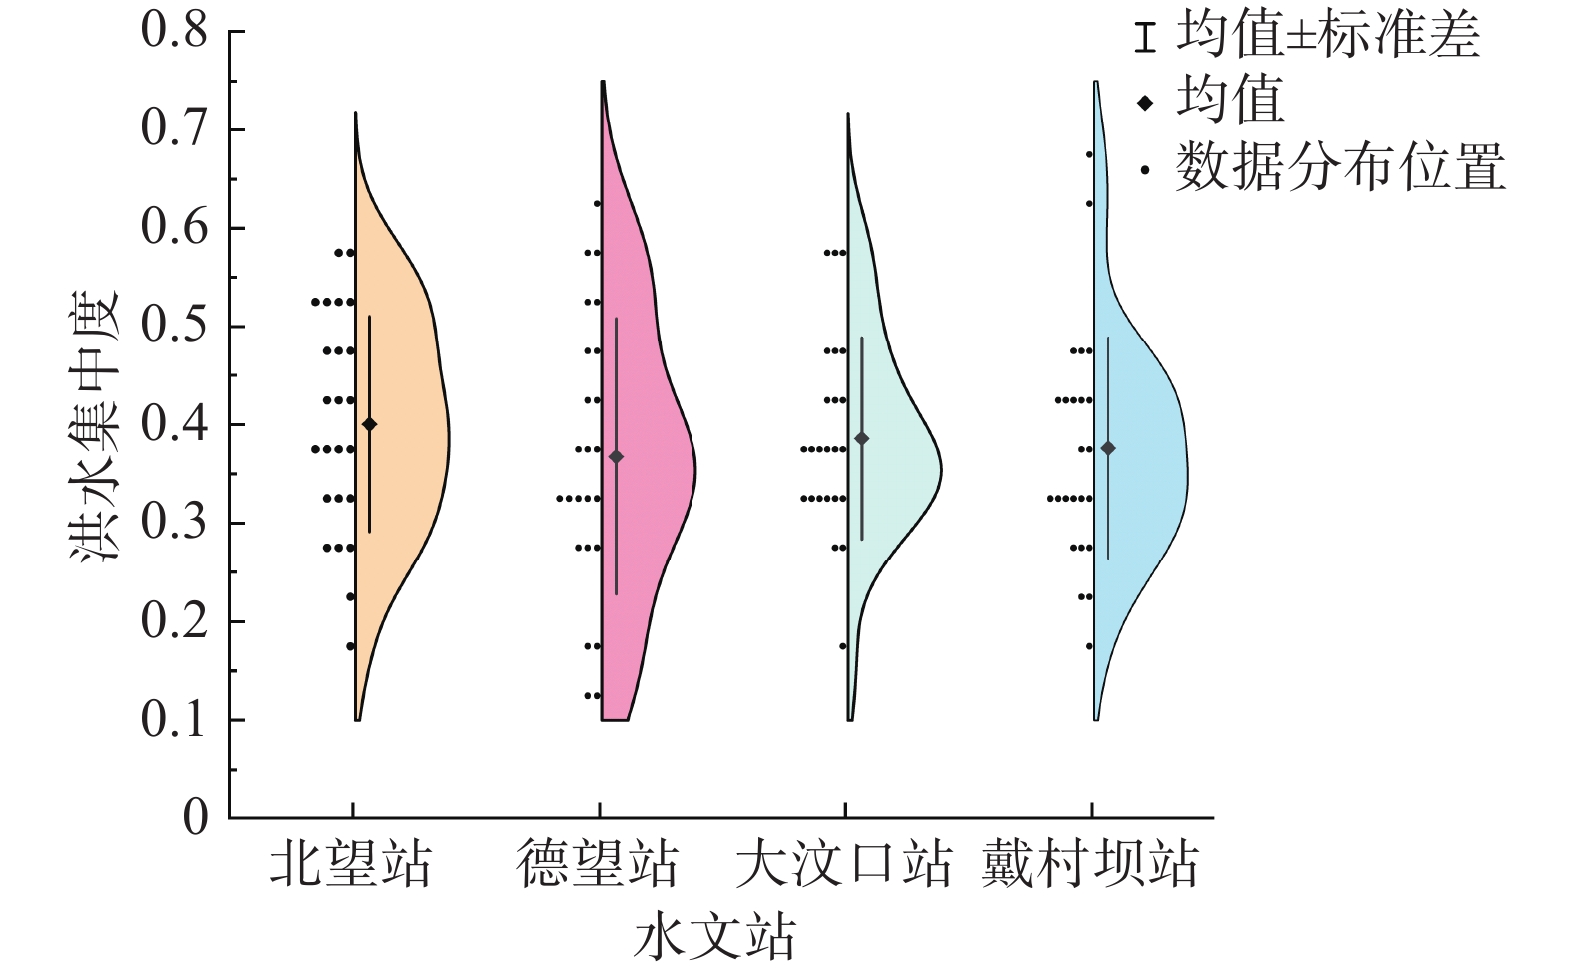
图 2 大汶河流域各站历次洪水特征值Figure 2. Characteristics of historical floods at various stations in the Dawen River Basin各站洪水集中度统计(图3)表明,整体集中度在0.4左右且分布较为一致,可见大汶河流域洪水过程分布较不均匀,洪水过程线涨落形态变化比较明显。在洪水形成过程中,地表径流受流域下垫面调蓄直接汇入河网至流域出口断面,具有传播速度快,流量过程陡涨陡落的特点,而壤中流、地下径流受土壤及地下含水层调蓄,运动速度较慢[20-21]。因此,大汶河洪水组成以地表径流为主,壤中流和地下径流占比较小。
![]() 图 3 大汶河流域各站历次洪水集中度Figure 3. Concentration of historical floods at various stations in the Dawen River Basin
图 3 大汶河流域各站历次洪水集中度Figure 3. Concentration of historical floods at various stations in the Dawen River Basin3.2 致洪暴雨特征分析
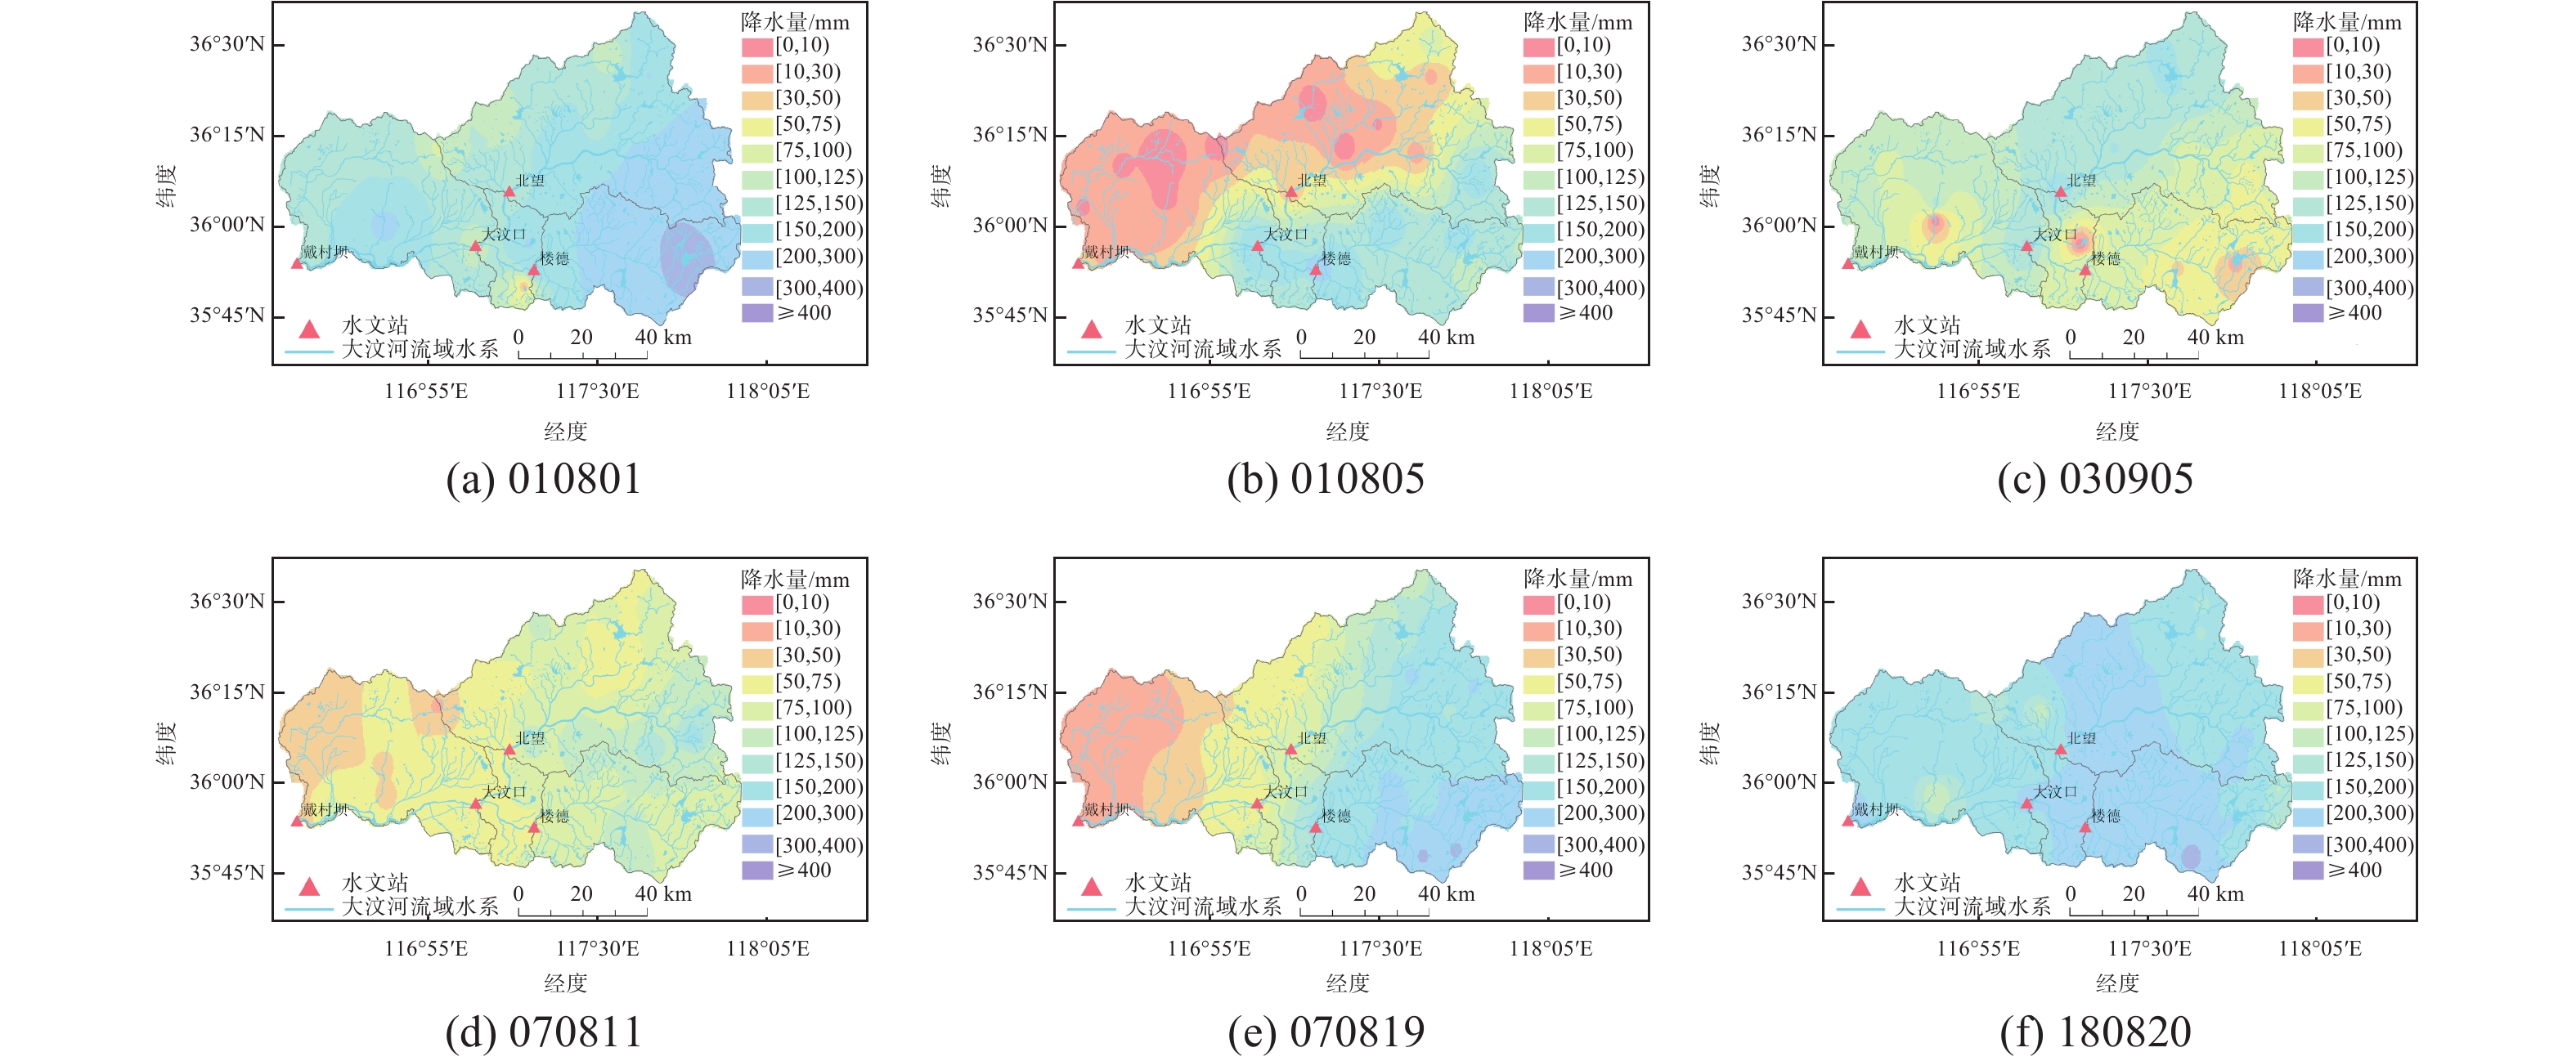
根据东平湖防洪方案,当大汶河流域出口控制站戴村坝站出现2 000~3 000 m3/s量级的洪水时,全流域防汛进入警戒状态,因此可认为出现2 000~3 000 m3/s量级洪水的年份为大水年份。大汶河流域大水年份(2001、2003、2007和2018年)场次洪水对应的同期次降水量空间分布如图4所示。由图4可知流域暴雨整体呈现出东多西少、北多南少的特点,暴雨(24 h降雨量超50 mm)笼罩面积约为全流域的1/3~1/2,暴雨中心多出现在流域上游山丘区大中型水库附近,例如图4(d)洪水编号为070811的暴雨集中分布在北支牟汶河,暴雨中心为葫芦山水库附近;图4(e)洪水编号为070819的暴雨集中分布在南支柴汶河,暴雨中心为东周水库附近。
![]() 图 4 大汶河流域致洪暴雨空间分布Figure 4. Spatial distribution of flood-causing rainfall in the Dawen River Basin
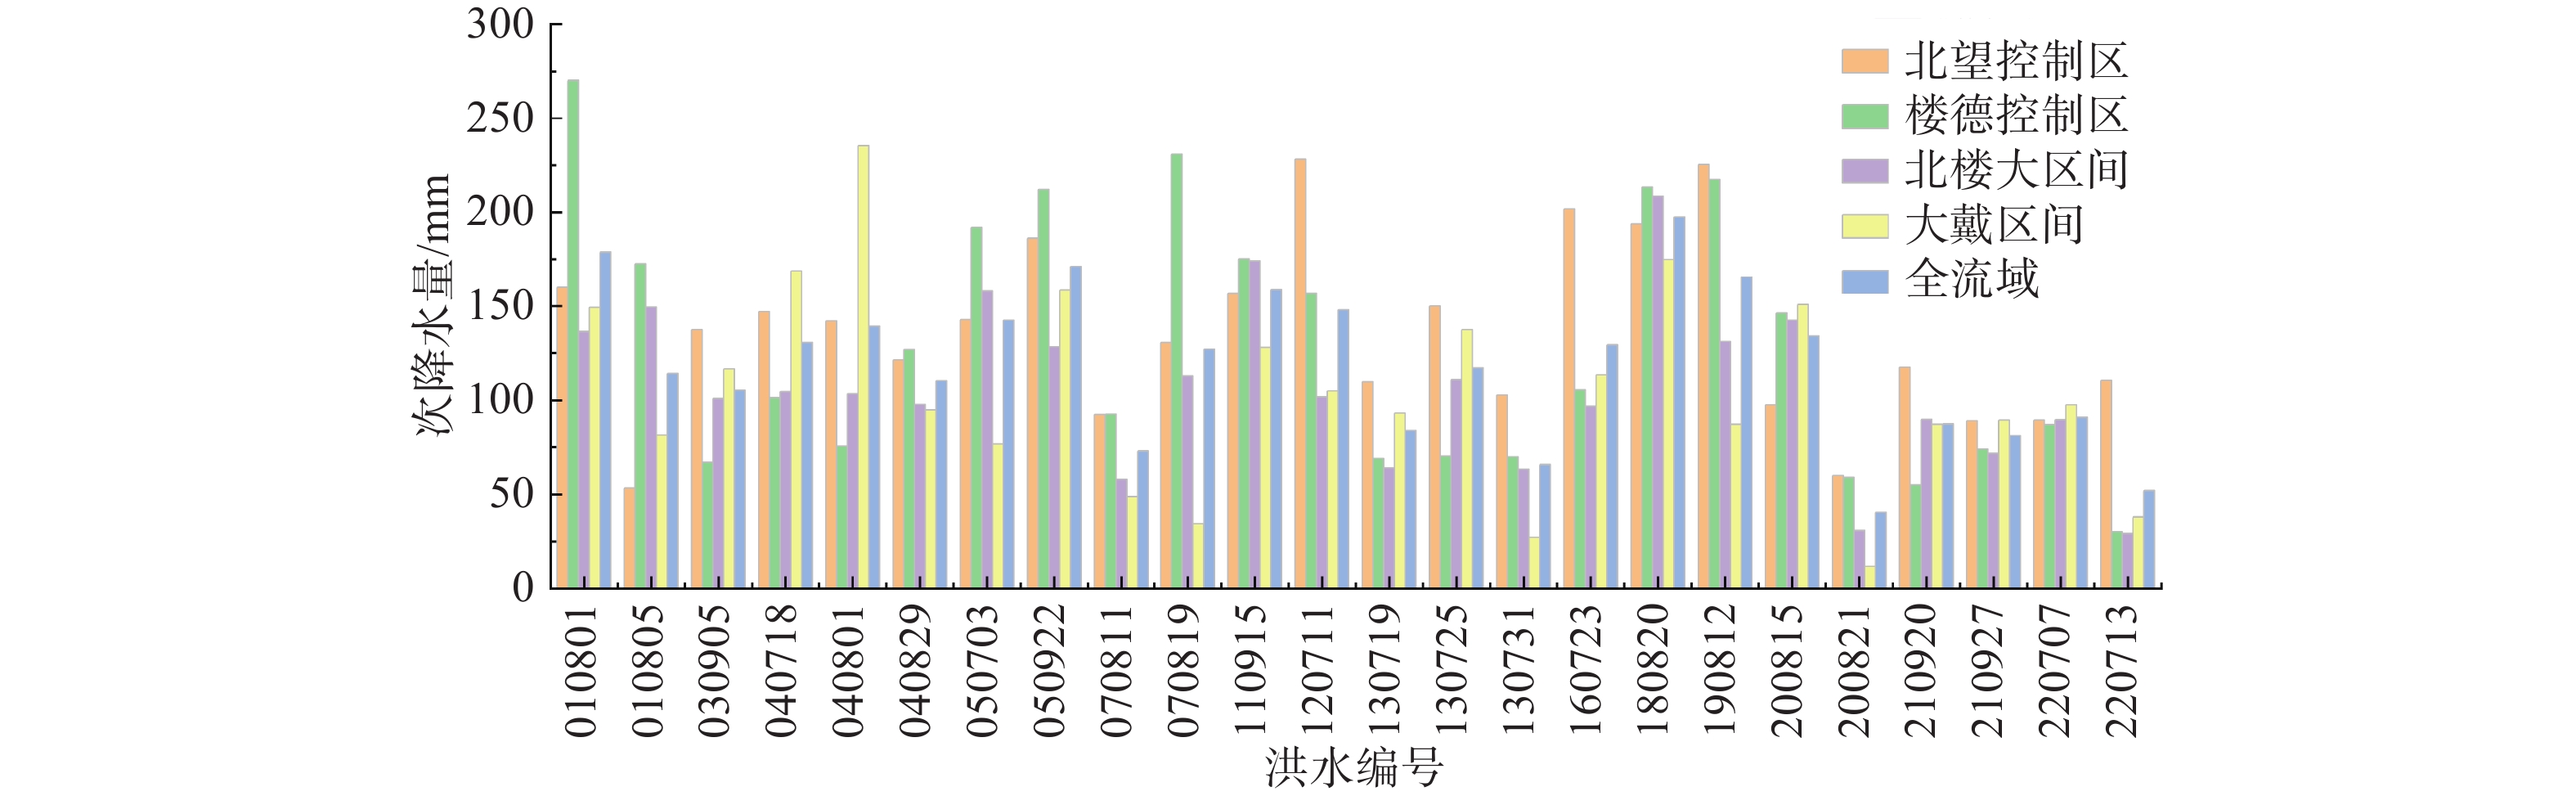
图 4 大汶河流域致洪暴雨空间分布Figure 4. Spatial distribution of flood-causing rainfall in the Dawen River Basin各集水单元与全流域的历次面平均降水量如图5所示。可知北望控制区、楼德控制区的统计平均值分别为135.2、127.9 mm,北楼大区间及大戴区间的统计平均值分别为106.4、104.4 mm,这表明近22年大汶河大汶口站以上范围是降水集中区,大戴区间范围的降水量相对较少。
![]() 图 5 大汶河流域各集水单元历次降水量Figure 5. Historical precipitation at various watersheds in the Dawen River Basin
图 5 大汶河流域各集水单元历次降水量Figure 5. Historical precipitation at various watersheds in the Dawen River Basin北望控制区、楼德控制区的时段最大降水量和降水空间矩指标计算结果见表2。可知,两个区的暴雨集中发生在24 h内,短时段最大降水量较为接近,1、6 h时段最大降水量的统计平均值相差不超过5 mm;两个区的一阶降水空间矩统计平均值分别为1.01、0.99,这表明暴雨集中分布在北支牟汶河中上游、南支柴汶河中下游;二阶降水空间矩均小于1,表明两个区往往只有1个暴雨中心。
表 2 北望及楼德控制区历史暴雨特征统计Table 2. Statistical analysis of historical characteristics of heavy rainfall in the Beiwang and Loude catchment areas编号 北望控制区 楼德控制区 时段最大降水量/mm $ {\delta }_{1} $ $ {\delta }_{2} $ 时段最大降水量/mm $ {\delta }_{1} $ $ {\delta }_{2} $ 1 h 6 h 24 h 48 h 1 h 6 h 24 h 48 h 010801 13.1 37.8 56.4 59.6 1.08 0.97 35.3 115.5 123.6 156.8 1.04 1.05 010805 9.8 28.7 28.7 28.7 1.38 0.74 29.4 142.5 172.6 172.6 0.98 0.96 030905 19.2 98.0 121.4 123.7 0.92 1.04 13.8 32.7 48.0 50.2 0.93 0.82 040718 12.7 54.6 106.1 121.8 0.96 0.95 8.7 32.4 64.0 83.4 1.05 1.07 040801 10.5 44.6 73.1 89.2 0.92 0.82 7.8 21.0 33.5 40.8 0.95 0.86 040829 10.3 30.3 100.5 119.8 1.03 0.98 15.5 38.4 108.3 124.4 0.99 0.96 050703 17.5 68.6 108.9 114.6 0.84 0.95 20.4 97.4 117.5 162.4 0.97 0.97 050922 11.2 45.2 76.8 102.5 1.00 0.91 13.6 66.5 47.7 96.8 1.02 1.02 070811 15.1 52.8 87.7 92.2 1.03 0.85 24.5 57.2 85.6 92.6 1.00 0.95 070819 14.5 38.2 70.9 125.9 1.04 0.90 15.9 86.8 166.9 220.3 1.03 1.00 110915 12.8 40.9 75.7 111.2 0.99 0.96 17.7 56.4 79.0 114.4 0.99 1.00 120711 20.2 84.8 142.2 185.8 1.02 1.02 12.9 52.8 80.0 132.2 1.05 1.01 130719 22.9 41.8 42.2 48.6 0.99 1.06 19.2 32.0 32.2 35.8 1.01 1.14 130725 15.1 41.4 54.8 93.2 1.04 1.08 7.7 13.5 32.7 55.4 0.94 0.88 130731 17.1 52.5 54.7 89.8 1.04 0.88 13.3 34.5 49.2 69.4 1.00 1.02 160723 14.0 68.8 118.8 137.6 1.04 0.96 13.3 59.8 98.8 104.7 0.99 0.93 180820 20.1 71.7 148.7 189.4 0.99 0.93 19.0 51.8 129.0 212.1 0.98 0.81 190812 13.9 72.2 173.8 212.4 1.05 1.00 16.2 78.8 178.8 217.2 1.02 1.06 200815 17.0 68.4 76.8 84.1 0.95 1.06 21.0 85.5 101.1 142.1 1.02 0.96 200821 11.5 41.8 53.6 57.4 1.11 0.89 11.3 38.2 46.7 53.9 1.01 0.93 210920 12.7 52.0 109.6 117.2 0.94 0.91 9.1 28.3 50.5 54.9 0.97 0.98 210927 8.8 30.9 62.6 87.0 0.96 0.97 11.7 39.1 49.5 72.3 0.99 1.00 220707 12.2 59.1 88.4 89.4 1.03 0.91 8.7 48.5 86.2 86.9 1.00 1.06 220713 16.1 75.2 98.5 99.0 1.00 0.85 4.9 12.6 16.1 16.2 0.93 0.73 平均值 14.5 54.2 88.8 107.5 1.01 0.94 15.5 55.1 83.2 107.0 0.99 0.96 北楼大区间、大戴区间的时段最大降水量和降水空间矩指标计算结果见表3。可知,北楼大区间的一阶降水空间矩统计平均值为1.00,二阶空间矩大于1,这表明该区间降水分布较为均匀,可能有多个暴雨中心,原因可能是该区间位于山前平原过渡带及两大支河交汇地带,易受到区域地形影响;大戴区间的一阶降水空间矩统计平均值为1.06,在4个集水单元中最大,二阶降水空间矩小于1,这表明该区间的暴雨集中分布在上游,大多数场次暴雨只有1个暴雨中心。
表 3 北楼大区间及大戴区间历史暴雨特征统计Table 3. Statistical analysis of historical characteristics of heavy rainfall in the Beilouda intervals and Dadai intervals编号 北楼大区间 大戴区间 时段最大降水量/mm $ {\delta }_{1} $ $ {\delta }_{2} $ 时段最大降水量/mm $ {\delta }_{1} $ $ {\delta }_{2} $ 1 h 6 h 24 h 48 h 1 h 6 h 24 h 48 h 010801 10.1 44.1 48.3 56.2 1.03 1.27 10.8 24.5 43.0 57.8 0.94 0.87 010805 23.6 121.1 130.4 148.1 0.93 1.77 13.4 26.7 41.4 41.4 1.36 0.73 030905 15.0 63.5 83.1 83.1 0.75 1.93 24.4 97.8 97.8 102.3 1.08 1.18 040718 18.5 46.7 76.0 86.3 1.01 1.13 23.4 86.6 135.7 141.4 1.01 1.02 040801 6.2 18.0 27.4 42.3 1.04 1.12 17.2 46.0 81.6 146.1 0.93 1.13 040829 10.0 34.7 87.4 96.8 0.93 1.74 10.0 40.7 77.0 94.0 1.02 1.07 050703 19.1 82.0 93.2 131.7 1.05 1.11 16.5 44.6 50.6 60.1 1.22 0.77 050922 7.3 36.0 53.4 74.2 1.03 1.15 11.2 61.6 68.7 78.0 1.04 0.98 070811 25.5 50.2 58.1 67.6 1.04 0.90 18.4 39.5 45.9 48.8 1.03 0.75 070819 10.6 40.8 67.8 111.5 1.12 0.61 2.8 12.3 24.9 32.2 1.14 0.86 110915 21.1 52.7 81.7 116.1 1.00 0.99 8.9 31.6 57.3 83.5 1.00 1.01 120711 11.2 32.6 55.3 78.6 0.98 1.06 10.2 36.5 64.7 73.7 1.04 0.84 130719 26.5 35.8 35.8 37.4 0.94 1.16 23.2 40.6 41.0 48.0 1.01 1.00 130725 16.7 37.2 57.9 79.4 0.99 1.01 13.2 43.9 73.6 87.3 1.02 1.27 130731 18.6 38.6 43.5 44.6 1.07 0.78 8.5 14.5 15.8 16.5 1.08 0.56 160723 19.1 45.6 94.0 95.8 1.06 0.82 12.8 55.0 92.1 100.1 1.04 0.93 180820 18.7 55.4 124.6 207.7 1.01 0.98 14.5 54.4 127.4 174.6 0.95 1.04 190812 11.8 46.1 121.3 143.6 1.04 0.89 5.5 20.8 58.5 82.0 1.09 0.76 200815 21.9 68.4 74.3 137.3 1.04 0.45 14.3 70.3 76.7 142.4 0.99 0.86 200821 4.9 19.3 25.5 28.6 0.98 1.12 1.8 6.8 10.0 11.7 1.18 0.94 210920 13.2 51.2 86.4 89.5 0.98 1.10 8.6 40.8 83.2 86.9 0.99 1.05 210927 10.9 35.7 43.7 71.0 1.00 1.01 10.1 41.3 57.2 87.9 0.95 0.98 220707 10.4 57.3 88.7 89.7 1.00 1.00 11.3 58.2 97.1 97.6 1.04 0.95 220713 3.8 10.3 14.8 22.1 0.99 1.09 7.8 16.4 25.8 29.2 1.23 0.58 平均值 14.8 46.8 69.7 89.1 1.00 1.09 12.5 42.1 64.5 80.1 1.06 0.92 3.3 洪水对致洪暴雨响应关系分析
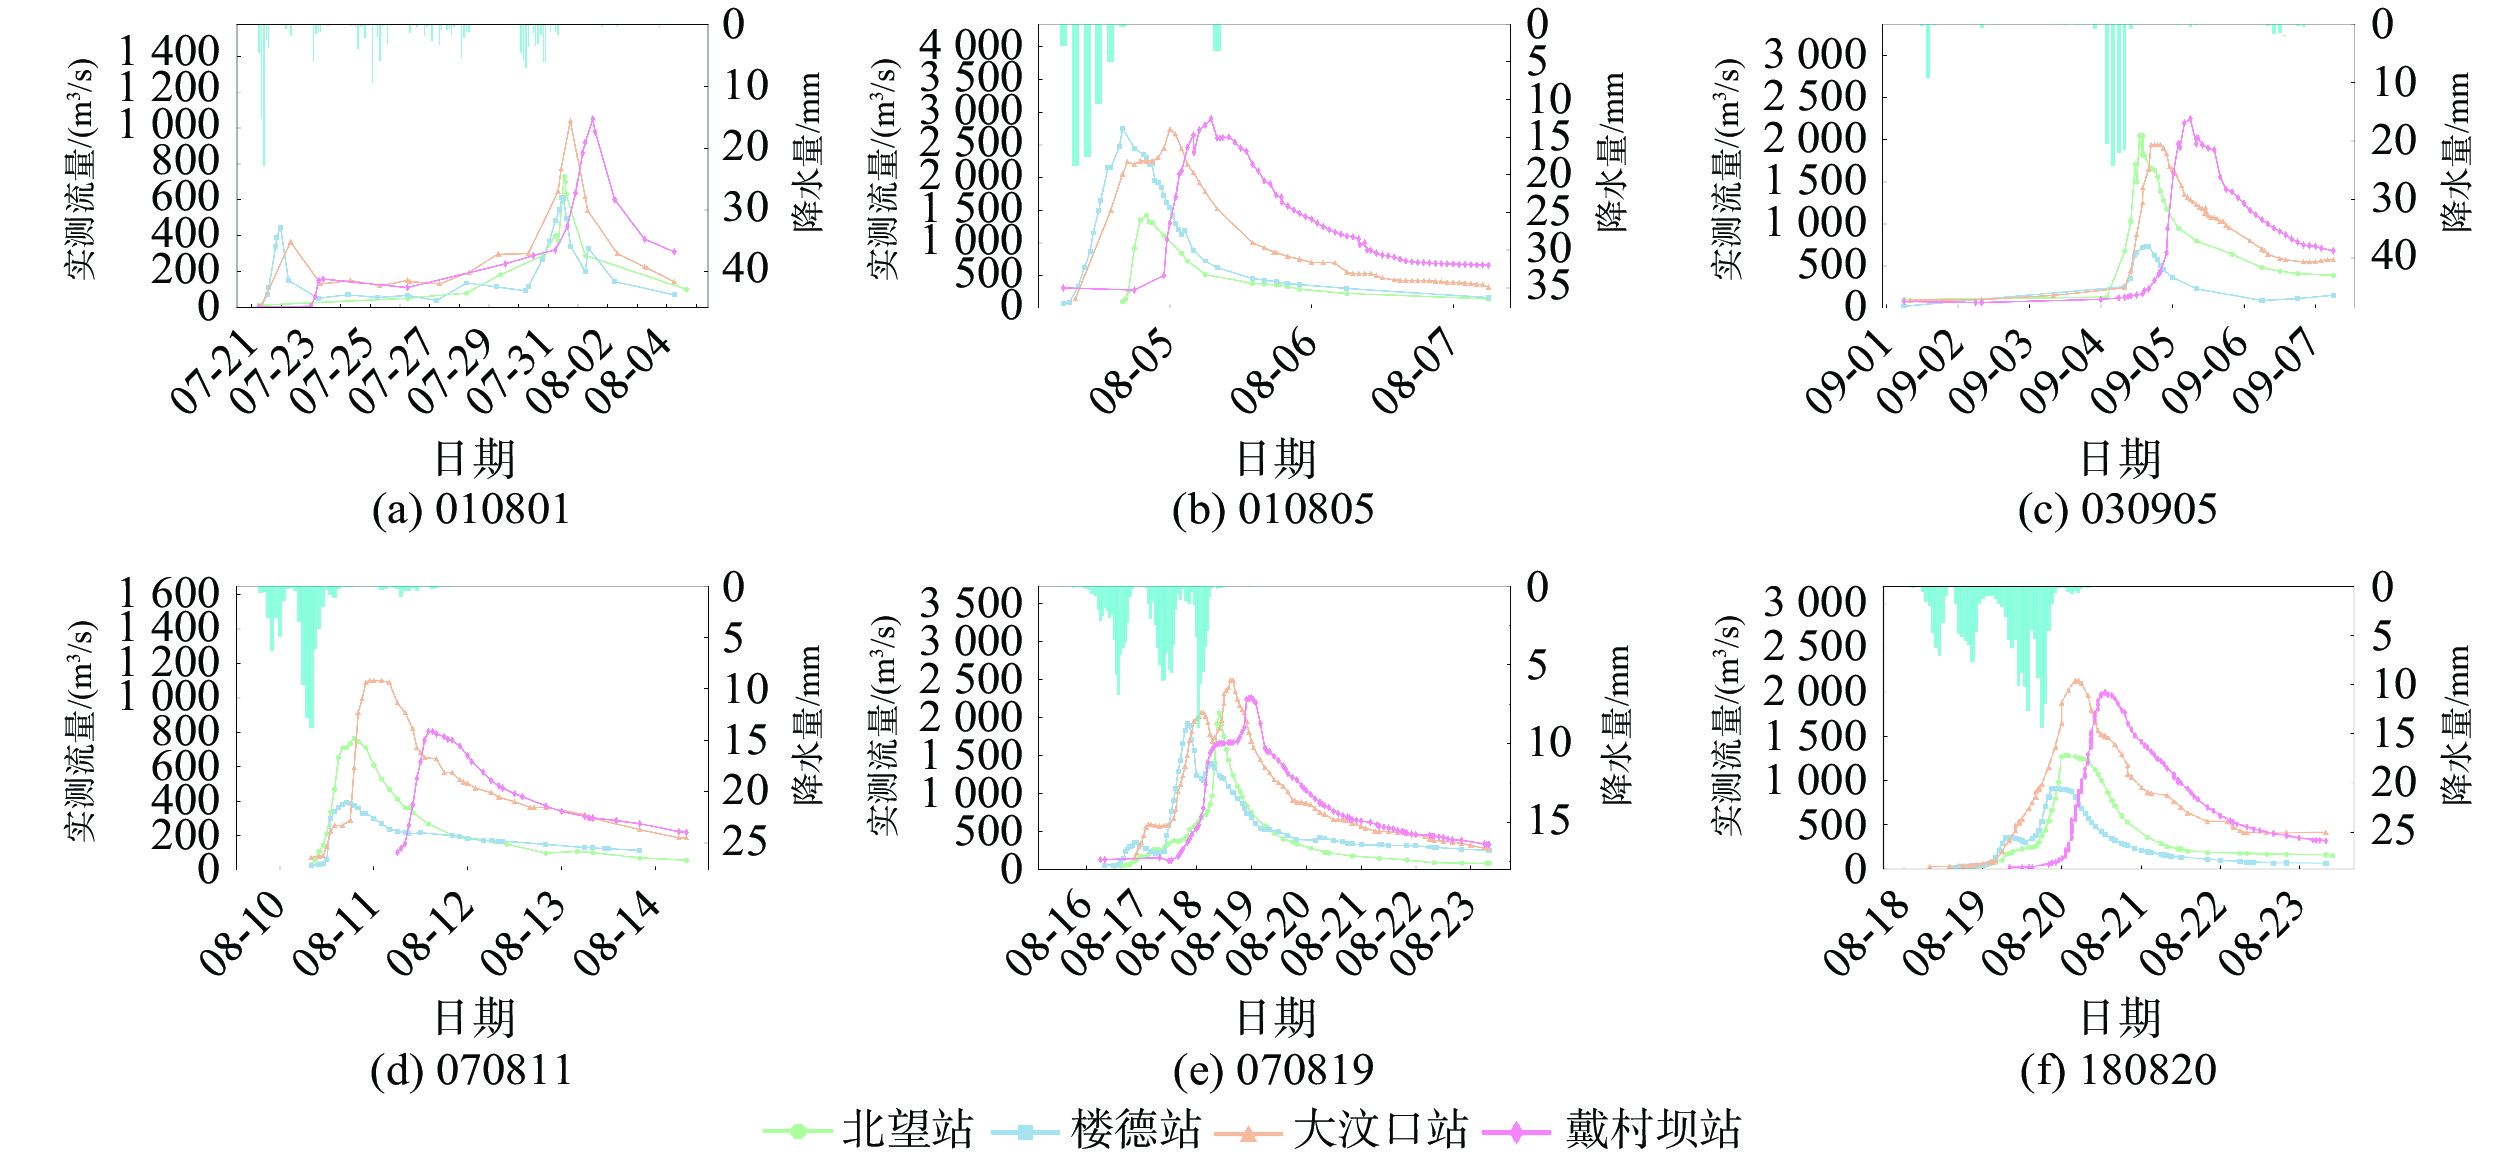
大汶河流域大水年份实测场次降雨洪水过程如图6所示。可知各站实测洪水对全流域面平均致洪暴雨的响应关系为:当流域前期降水量较小时,上游北望站、楼德站实测洪水为1个小洪峰,下游大汶口站、戴村坝站实测流量相差较小;当流域前期降水量较大并出现本次暴雨的主雨峰时,上游北望站、楼德站将出现大洪峰,大汶口站对上游来洪响应迅速,戴村坝站由于距离较远响应滞后;当降雨出现多个峰值时,大汶河易出现复式洪水,相邻的雨峰时间间隔越长,实测的复式洪水特征越明显。
![]() 图 6 大汶河流域历次暴雨洪水过程Figure 6. Historical episodes of heavy rainfall and floods in the Dawen River Basin
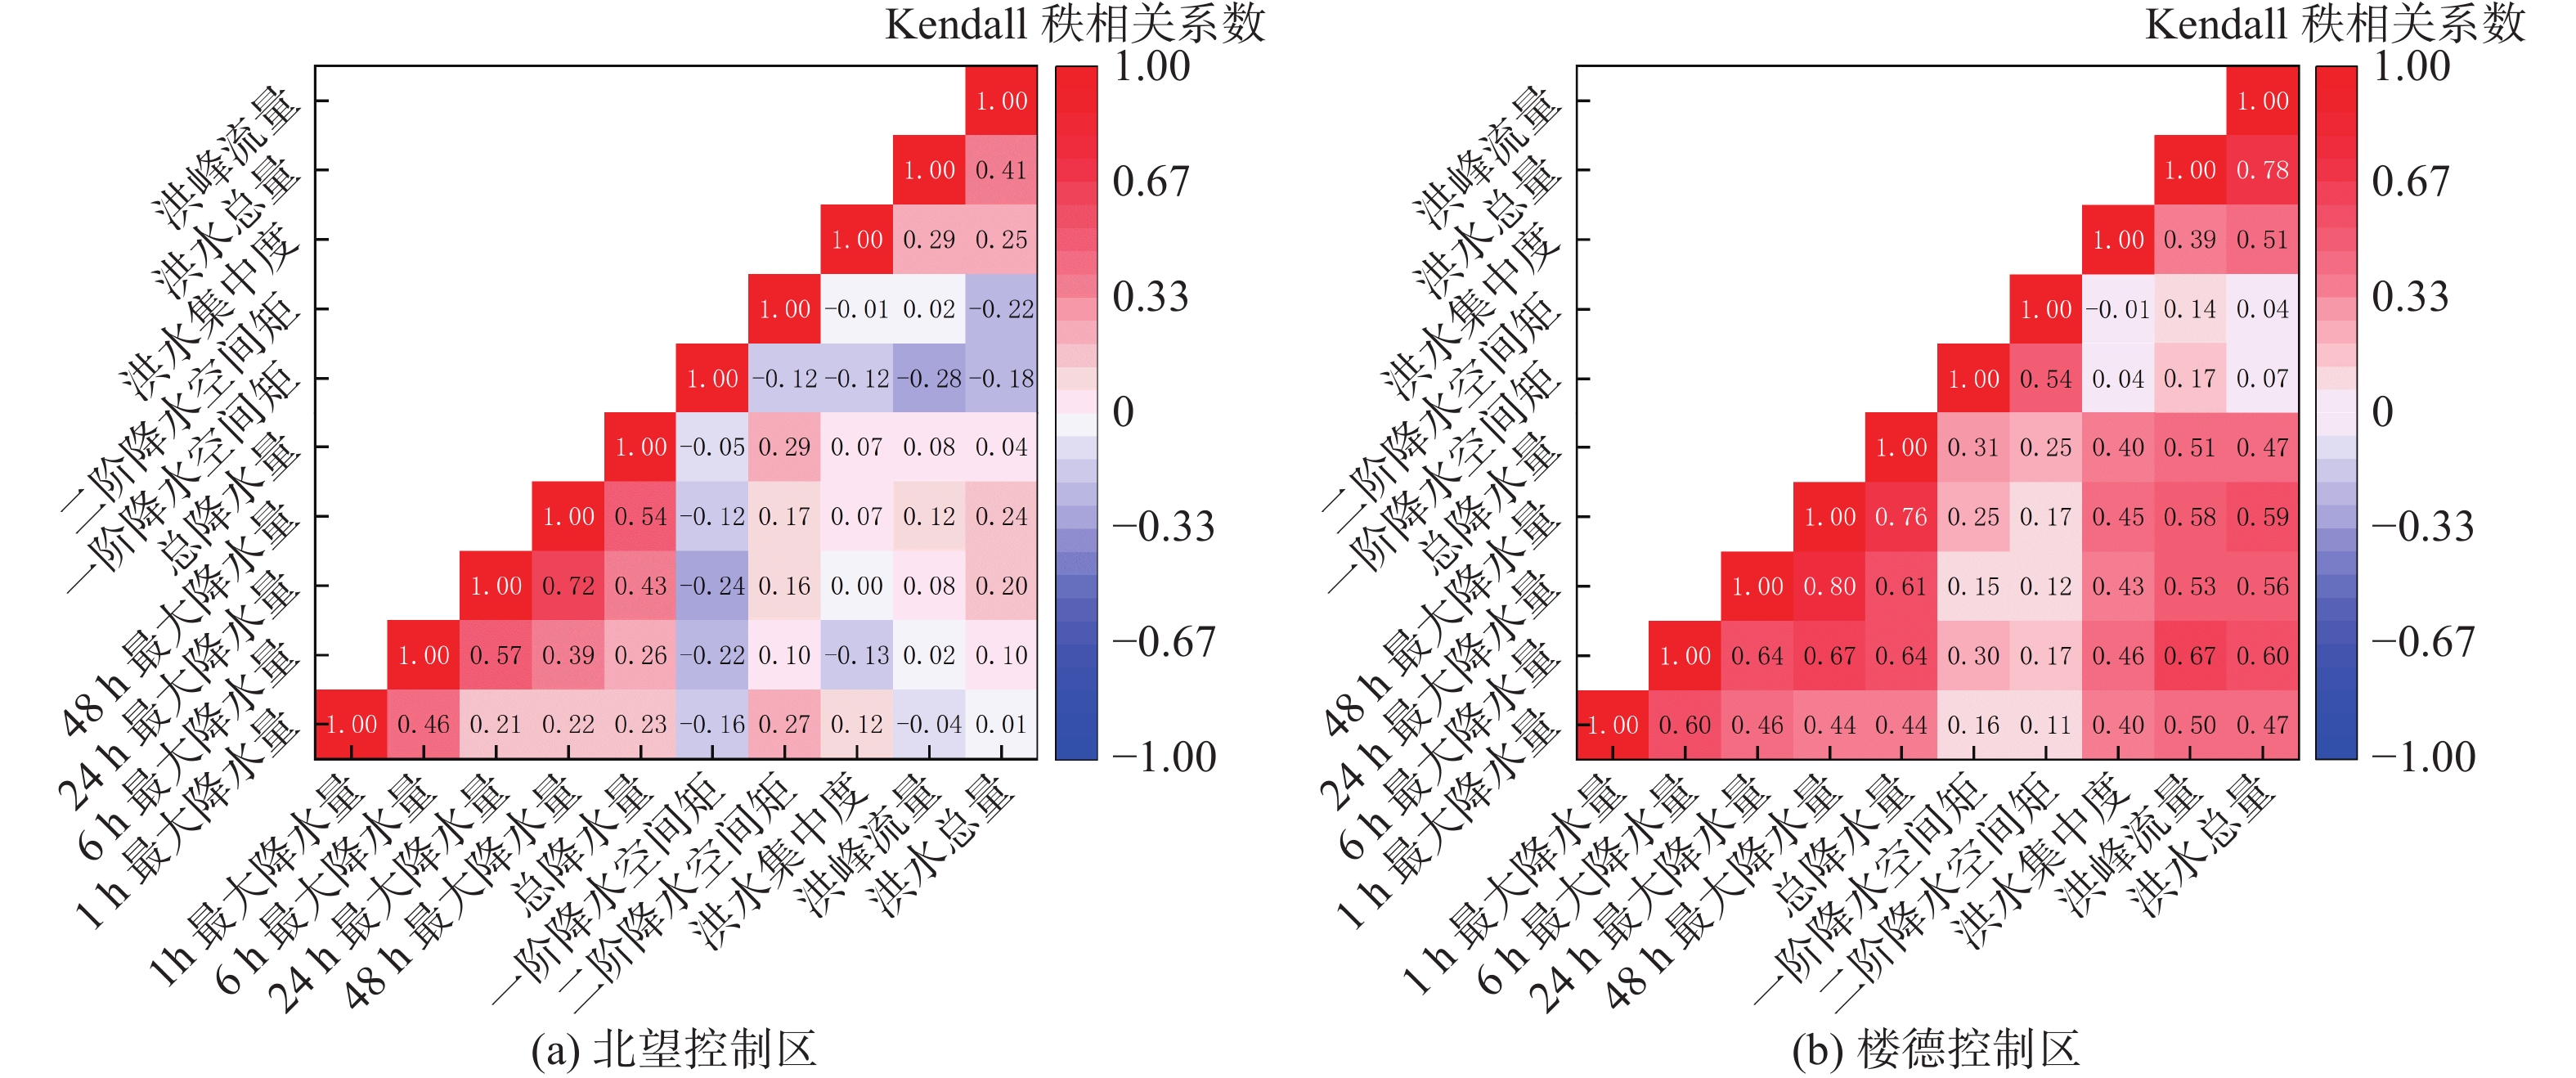
图 6 大汶河流域历次暴雨洪水过程Figure 6. Historical episodes of heavy rainfall and floods in the Dawen River Basin研究发现北望控制区(北支牟汶河子流域)、楼德控制区(南支柴汶河子流域)是大汶河洪水的主要来源区,采用Kendall秩相关分析法研究这两个区的暴雨洪水响应规律,各项特征指标值计算成果见图7。可知北望控制区的洪水特征值对致洪暴雨的时段最大降水量、总降水量表现出较弱的正向相关性,相关系数为0~0.2,这表明北望控制区的洪水特征受多种因素影响,在某些场次洪水中,致洪暴雨强度因素的影响并不突出。此外,北望控制区的洪水特征值对一阶降水空间矩表现出一定的负向相关性,相关系数为−0.3~0,这表明暴雨中心越接近该区域上游,洪水强度在一定程度上越会被削弱,原因在于流域上游大中型水库对降雨入流的调节。相反,楼德控制区的洪水特征值对致洪暴雨的特征值表现出较好的正向相关性,场次洪水强度对致洪暴雨表现出较强的敏感性。
![]() 图 7 北望及楼德控制区暴雨洪水特征指标Kendall秩相关系数Figure 7. Kendall rank correlation coefficients of flood characteristics in the Beiwang and Loude catchment areas
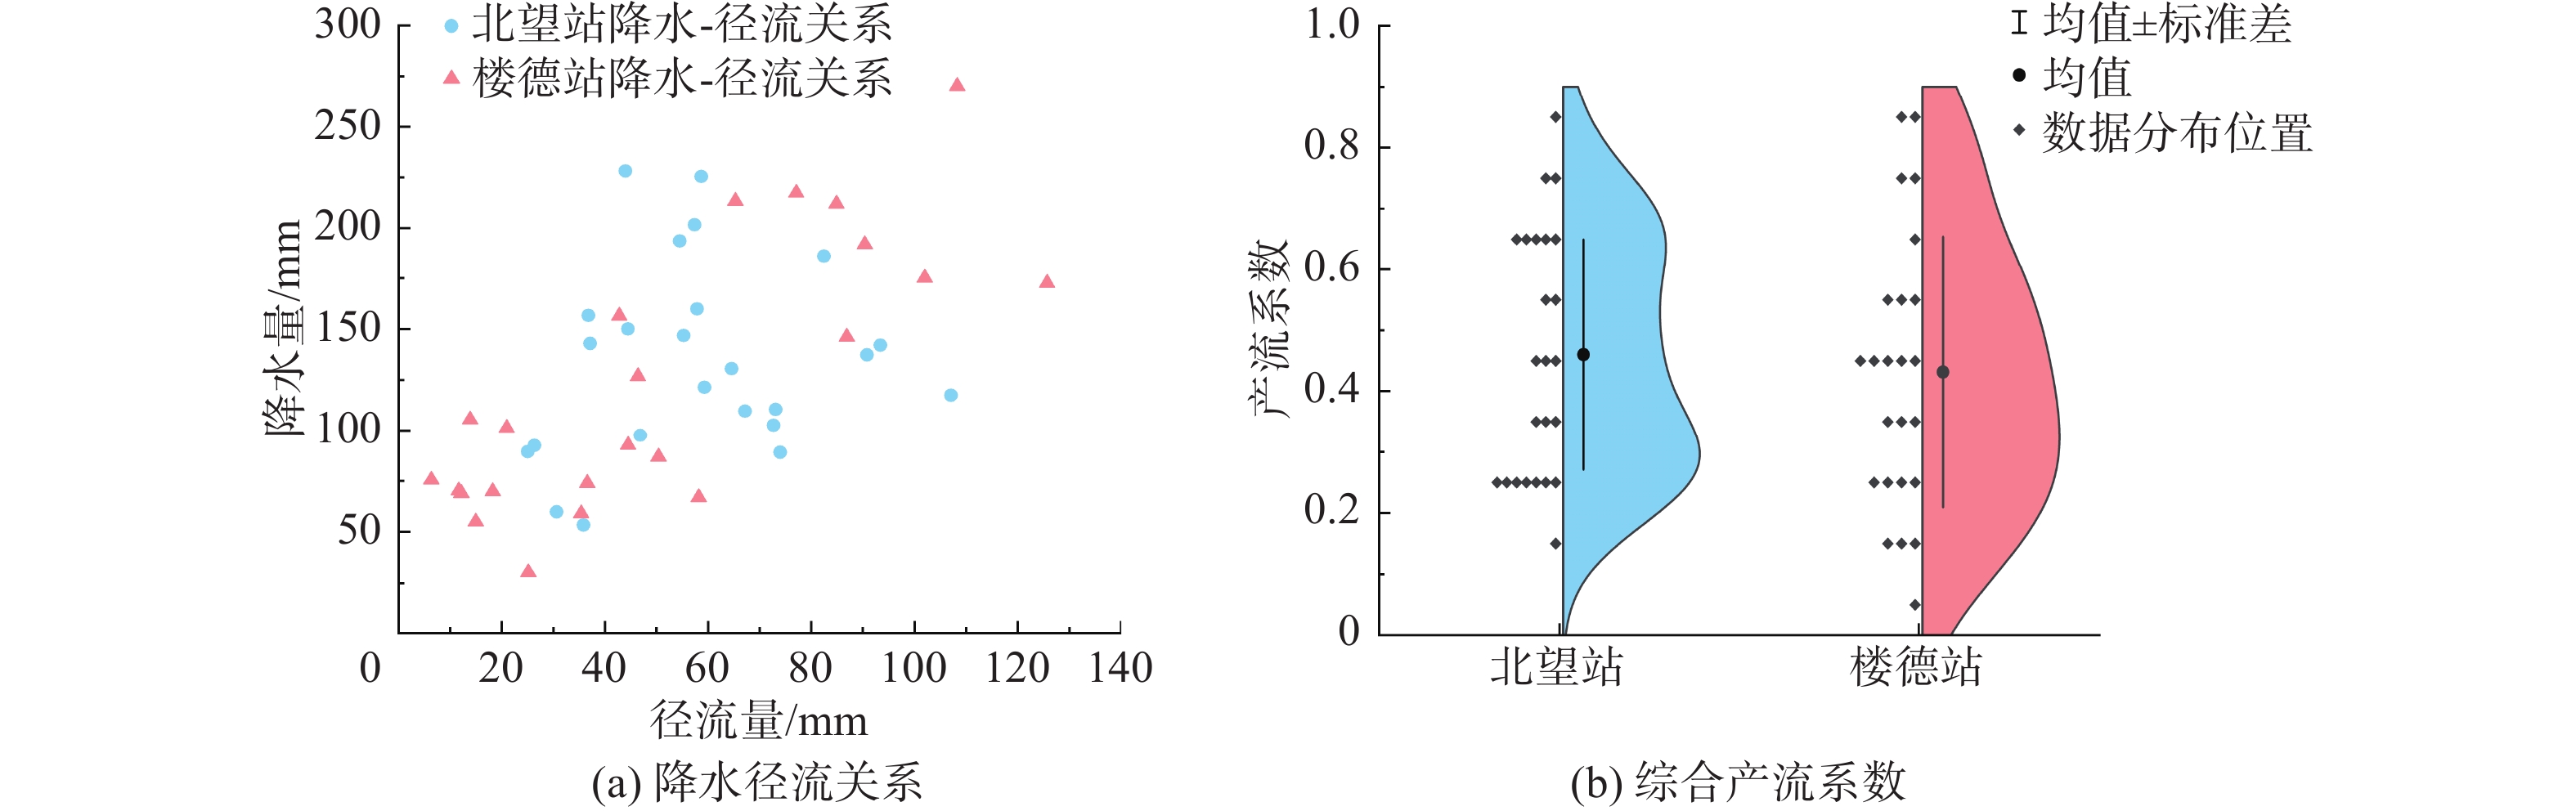
图 7 北望及楼德控制区暴雨洪水特征指标Kendall秩相关系数Figure 7. Kendall rank correlation coefficients of flood characteristics in the Beiwang and Loude catchment areas北望控制区、楼德控制区的降水-径流关系及产流系数分别见图8。可知,汛初第1场降水以补充土壤含水量为主,暴雨-洪水的产流系数较小。以北望控制区为例,2007年的第1场暴雨洪水的产流系数为0.29,第2场的产流系数提高到0.50。两个区域历次暴雨洪水的产流系数统计平均值分别为0.46和0.43,依据通常蓄满产流地区产流系数大于0.40、超渗产流地区产流系数小于0.20的经验,结合大汶河流域地处半湿润地区,多年平均降水量大于400 mm,以及洪水集中度的统计结果,分析认为北支牟汶河与南支柴汶河子流域的产流表现为以蓄满产流为主,兼有超渗产流发生的特征。
![]() 图 8 北望及楼德控制区降水径流关系与产流系数Figure 8. Precipitation-runoff relationship and runoff coefficients in the Beiwang and Loude catchment areas
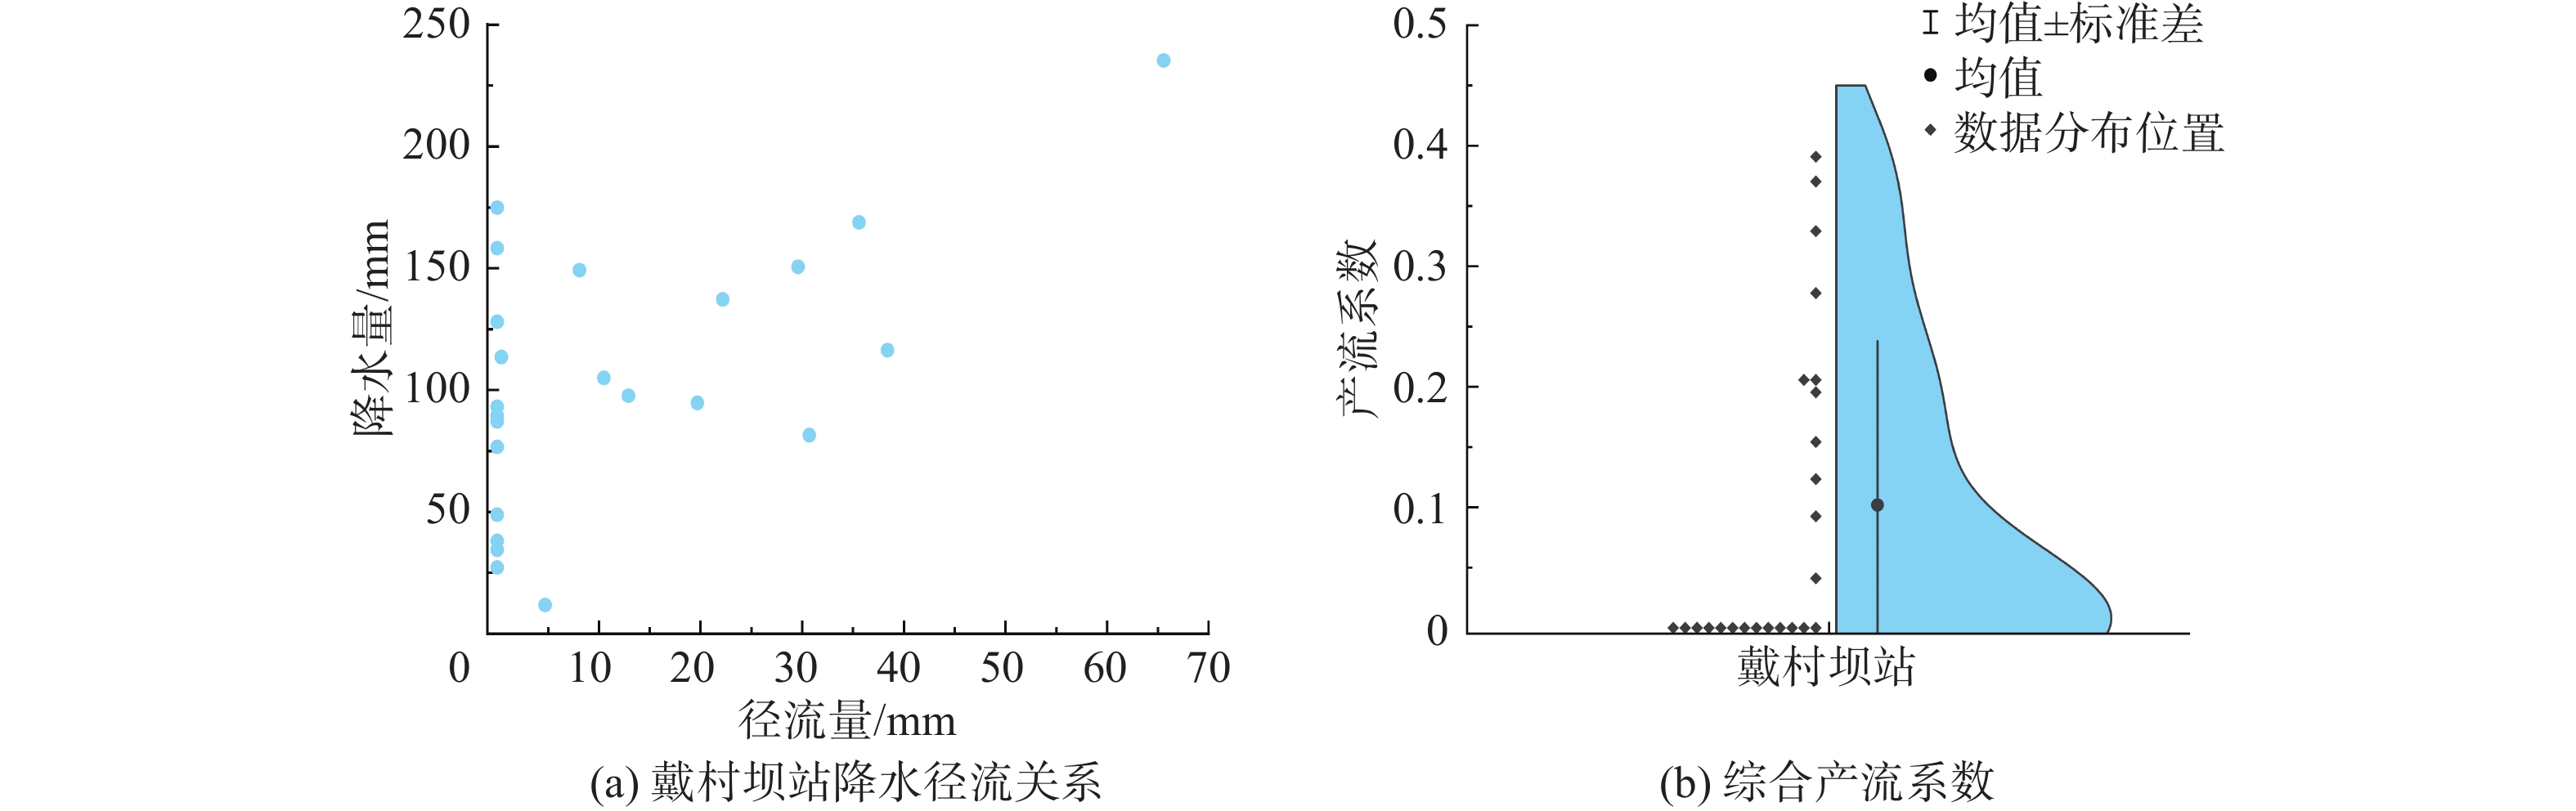
图 8 北望及楼德控制区降水径流关系与产流系数Figure 8. Precipitation-runoff relationship and runoff coefficients in the Beiwang and Loude catchment areas由于北楼大区间集水面积相对较小,可忽略该区间来水影响,重点针对大戴区间的暴雨洪水关系进行分析。该区间径流量采用戴村坝站观测次洪总量减去大汶口站观测次洪总量的方法进行计算,针对个别场次暴雨洪水出现戴村坝站次洪总量小于大汶口站次洪总量的情况,认为该区间的径流量为0,大戴区间的降水-径流关系及产流系数见图9。可知,自2005年始,多数年份大戴区间的径流量为0,在降水量同期偏多的年份会出现产流,产流系数为0.1~0.4,总体小于南北两支子流域的产流系数。以2020年为例,结合文献[22],大汶河流域在8月1日、6日发生了2次降水,全流域平均降水量分别为116.8、89.7 mm,经过2次降水补充土壤含水量及地下水后,大戴区间土壤及地下水整体较为饱和,因此在后续的8月15日、21日的降水中出现了区间产流。
![]() 图 9 大戴区间降水径流关系与产流系数Figure 9. Precipitation-runoff relationship and runoff coefficients in the Dadai interval
图 9 大戴区间降水径流关系与产流系数Figure 9. Precipitation-runoff relationship and runoff coefficients in the Dadai interval4. 结 语
本研究基于2001—2022年大汶河流域实测降雨与洪水时间序列数据,开展了暴雨、洪水及其关系特征值的统计、计算及分析,细化分析了4个集水水文单元暴雨洪水特征,识别计算了大汶河洪水主要来源区及其暴雨洪水特征值Kendall秩相关系数,同时分析了北望控制区、楼德控制区、大戴区间的暴雨洪水关系,计算区域产流系数并进行降水-径流关系分析,结论如下:
(1)近22年,大汶河洪水的流域降雨空间分布呈现东多西少、北多南少特征,洪水对应的暴雨事件通常覆盖全流域面积的1/3~1/2,暴雨中心多集中在上游大中型水库附近,北支牟汶河子流域、南支柴汶河子流域的1 h、6 h暴雨短期历时特征接近,次降水量北支较南支多。
(2)近22年,北望站实测历史洪水总量的统计平均值是楼德站的2倍,表明北支牟汶河子流域是大汶河洪水的主要来源;大戴区间多场次洪水总量计算存在负值,表明大戴区间的产流机制十分复杂。北望控制区的洪水特征值与致洪暴雨强度呈弱正相关,与一阶降水空间矩呈负相关,暴雨中心接近上游山丘区时,站点洪水强度减弱,这表明北支牟汶河子流域对致洪暴雨具有较强的调蓄能力。相反,楼德控制区的洪水特征值与致洪暴雨特征值的关联更强,显示出较高敏感性,这表明南支柴汶河子流域的防洪能力整体弱于北支。
(3)大汶河流域汛初第1场降水往往以补充土壤含水量为主,暴雨-洪水的产流系数较小,整体产流表现为蓄满产流为主,兼有超渗产流的特点。大戴区间产流量少,与该区间以松散岩类孔隙含水岩组为主、具有较好富水性的地质条件及中小洪水条件下灌区引水密切相关,在大汶河流域水文模拟与洪水预报时应特别关注。
-
![]()
图 2 大汶河流域各站历次洪水特征值
Figure 2. Characteristics of historical floods at various stations in the Dawen River Basin
![]()
图 3 大汶河流域各站历次洪水集中度
Figure 3. Concentration of historical floods at various stations in the Dawen River Basin
![]()
图 4 大汶河流域致洪暴雨空间分布
Figure 4. Spatial distribution of flood-causing rainfall in the Dawen River Basin
![]()
图 5 大汶河流域各集水单元历次降水量
Figure 5. Historical precipitation at various watersheds in the Dawen River Basin
![]()
图 6 大汶河流域历次暴雨洪水过程
Figure 6. Historical episodes of heavy rainfall and floods in the Dawen River Basin
![]()
图 7 北望及楼德控制区暴雨洪水特征指标Kendall秩相关系数
Figure 7. Kendall rank correlation coefficients of flood characteristics in the Beiwang and Loude catchment areas
![]()
图 8 北望及楼德控制区降水径流关系与产流系数
Figure 8. Precipitation-runoff relationship and runoff coefficients in the Beiwang and Loude catchment areas
![]()
图 9 大戴区间降水径流关系与产流系数
Figure 9. Precipitation-runoff relationship and runoff coefficients in the Dadai interval
表 1 各水文单元水文地理特征统计
Table 1 Statistical analysis of hydrological and geographical characteristics of each hydrological unit
序号 集水单元 控制站点 单元面积/
km2大中型水库控制
面积/km2高程范围/m 1 北望控制区 北望站 3 551 1 496 111~1 524 2 楼德控制区 楼德站 1 668 468 109~978 3 北楼大区间 大汶口站 477 73 85~1 023 4 大戴区间 戴村坝站 2 568 173 23~612  下载: 导出CSV
表 2 北望及楼德控制区历史暴雨特征统计
Table 2 Statistical analysis of historical characteristics of heavy rainfall in the Beiwang and Loude catchment areas
编号 北望控制区 楼德控制区 时段最大降水量/mm $ {\delta }_{1} $ $ {\delta }_{2} $ 时段最大降水量/mm $ {\delta }_{1} $ $ {\delta }_{2} $ 1 h 6 h 24 h 48 h 1 h 6 h 24 h 48 h 010801 13.1 37.8 56.4 59.6 1.08 0.97 35.3 115.5 123.6 156.8 1.04 1.05 010805 9.8 28.7 28.7 28.7 1.38 0.74 29.4 142.5 172.6 172.6 0.98 0.96 030905 19.2 98.0 121.4 123.7 0.92 1.04 13.8 32.7 48.0 50.2 0.93 0.82 040718 12.7 54.6 106.1 121.8 0.96 0.95 8.7 32.4 64.0 83.4 1.05 1.07 040801 10.5 44.6 73.1 89.2 0.92 0.82 7.8 21.0 33.5 40.8 0.95 0.86 040829 10.3 30.3 100.5 119.8 1.03 0.98 15.5 38.4 108.3 124.4 0.99 0.96 050703 17.5 68.6 108.9 114.6 0.84 0.95 20.4 97.4 117.5 162.4 0.97 0.97 050922 11.2 45.2 76.8 102.5 1.00 0.91 13.6 66.5 47.7 96.8 1.02 1.02 070811 15.1 52.8 87.7 92.2 1.03 0.85 24.5 57.2 85.6 92.6 1.00 0.95 070819 14.5 38.2 70.9 125.9 1.04 0.90 15.9 86.8 166.9 220.3 1.03 1.00 110915 12.8 40.9 75.7 111.2 0.99 0.96 17.7 56.4 79.0 114.4 0.99 1.00 120711 20.2 84.8 142.2 185.8 1.02 1.02 12.9 52.8 80.0 132.2 1.05 1.01 130719 22.9 41.8 42.2 48.6 0.99 1.06 19.2 32.0 32.2 35.8 1.01 1.14 130725 15.1 41.4 54.8 93.2 1.04 1.08 7.7 13.5 32.7 55.4 0.94 0.88 130731 17.1 52.5 54.7 89.8 1.04 0.88 13.3 34.5 49.2 69.4 1.00 1.02 160723 14.0 68.8 118.8 137.6 1.04 0.96 13.3 59.8 98.8 104.7 0.99 0.93 180820 20.1 71.7 148.7 189.4 0.99 0.93 19.0 51.8 129.0 212.1 0.98 0.81 190812 13.9 72.2 173.8 212.4 1.05 1.00 16.2 78.8 178.8 217.2 1.02 1.06 200815 17.0 68.4 76.8 84.1 0.95 1.06 21.0 85.5 101.1 142.1 1.02 0.96 200821 11.5 41.8 53.6 57.4 1.11 0.89 11.3 38.2 46.7 53.9 1.01 0.93 210920 12.7 52.0 109.6 117.2 0.94 0.91 9.1 28.3 50.5 54.9 0.97 0.98 210927 8.8 30.9 62.6 87.0 0.96 0.97 11.7 39.1 49.5 72.3 0.99 1.00 220707 12.2 59.1 88.4 89.4 1.03 0.91 8.7 48.5 86.2 86.9 1.00 1.06 220713 16.1 75.2 98.5 99.0 1.00 0.85 4.9 12.6 16.1 16.2 0.93 0.73 平均值 14.5 54.2 88.8 107.5 1.01 0.94 15.5 55.1 83.2 107.0 0.99 0.96
下载: 导出CSV
表 3 北楼大区间及大戴区间历史暴雨特征统计
Table 3 Statistical analysis of historical characteristics of heavy rainfall in the Beilouda intervals and Dadai intervals
编号 北楼大区间 大戴区间 时段最大降水量/mm $ {\delta }_{1} $ $ {\delta }_{2} $ 时段最大降水量/mm $ {\delta }_{1} $ $ {\delta }_{2} $ 1 h 6 h 24 h 48 h 1 h 6 h 24 h 48 h 010801 10.1 44.1 48.3 56.2 1.03 1.27 10.8 24.5 43.0 57.8 0.94 0.87 010805 23.6 121.1 130.4 148.1 0.93 1.77 13.4 26.7 41.4 41.4 1.36 0.73 030905 15.0 63.5 83.1 83.1 0.75 1.93 24.4 97.8 97.8 102.3 1.08 1.18 040718 18.5 46.7 76.0 86.3 1.01 1.13 23.4 86.6 135.7 141.4 1.01 1.02 040801 6.2 18.0 27.4 42.3 1.04 1.12 17.2 46.0 81.6 146.1 0.93 1.13 040829 10.0 34.7 87.4 96.8 0.93 1.74 10.0 40.7 77.0 94.0 1.02 1.07 050703 19.1 82.0 93.2 131.7 1.05 1.11 16.5 44.6 50.6 60.1 1.22 0.77 050922 7.3 36.0 53.4 74.2 1.03 1.15 11.2 61.6 68.7 78.0 1.04 0.98 070811 25.5 50.2 58.1 67.6 1.04 0.90 18.4 39.5 45.9 48.8 1.03 0.75 070819 10.6 40.8 67.8 111.5 1.12 0.61 2.8 12.3 24.9 32.2 1.14 0.86 110915 21.1 52.7 81.7 116.1 1.00 0.99 8.9 31.6 57.3 83.5 1.00 1.01 120711 11.2 32.6 55.3 78.6 0.98 1.06 10.2 36.5 64.7 73.7 1.04 0.84 130719 26.5 35.8 35.8 37.4 0.94 1.16 23.2 40.6 41.0 48.0 1.01 1.00 130725 16.7 37.2 57.9 79.4 0.99 1.01 13.2 43.9 73.6 87.3 1.02 1.27 130731 18.6 38.6 43.5 44.6 1.07 0.78 8.5 14.5 15.8 16.5 1.08 0.56 160723 19.1 45.6 94.0 95.8 1.06 0.82 12.8 55.0 92.1 100.1 1.04 0.93 180820 18.7 55.4 124.6 207.7 1.01 0.98 14.5 54.4 127.4 174.6 0.95 1.04 190812 11.8 46.1 121.3 143.6 1.04 0.89 5.5 20.8 58.5 82.0 1.09 0.76 200815 21.9 68.4 74.3 137.3 1.04 0.45 14.3 70.3 76.7 142.4 0.99 0.86 200821 4.9 19.3 25.5 28.6 0.98 1.12 1.8 6.8 10.0 11.7 1.18 0.94 210920 13.2 51.2 86.4 89.5 0.98 1.10 8.6 40.8 83.2 86.9 0.99 1.05 210927 10.9 35.7 43.7 71.0 1.00 1.01 10.1 41.3 57.2 87.9 0.95 0.98 220707 10.4 57.3 88.7 89.7 1.00 1.00 11.3 58.2 97.1 97.6 1.04 0.95 220713 3.8 10.3 14.8 22.1 0.99 1.09 7.8 16.4 25.8 29.2 1.23 0.58 平均值 14.8 46.8 69.7 89.1 1.00 1.09 12.5 42.1 64.5 80.1 1.06 0.92
下载: 导出CSV
-
[1] 高峰, 武士国. 黄河汶河洪水遭遇及调度措施分析[J]. 山东水利,2011(4):21-22. (GAO Feng, WU Shiguo. Analysis of flood encounter and dispatching measures in Wenhe River of Yellow River[J]. Shandong Water Resources, 2011(4): 21-22. (in Chinese) doi: 10.3969/j.issn.1009-6159.2011.04.009 GAO Feng, WU Shiguo. Analysis of flood encounter and dispatching measures in Wenhe River of Yellow River[J]. Shandong Water Resources, 2011(4): 21-22. (in Chinese) doi: 10.3969/j.issn.1009-6159.2011.04.009
[2] 邓爱丽. 大汶河干流行洪能力分析及防洪对策研究[D]. 泰安: 山东农业大学, 2011. (DENG Aili. Analysis of flood accommodate capacity and flood-proof countermeasure study of the Dawenhe main watercourse[D]. Taian: Shandong Agricultural University, 2011. (in Chinese) DENG Aili. Analysis of flood accommodate capacity and flood-proof countermeasure study of the Dawenhe main watercourse[D]. Taian: Shandong Agricultural University, 2011. (in Chinese)
[3] 任艳粉. 东平湖滞洪区在黄河下游防洪工程体系中的地位[C]∥第十五届中国海洋(岸)工程学术讨论会论文集(中). 北京: 海洋出版社, 2011: 1337-1338. (REN Yanfen. The status of Dongping lake flood detention area in the flood control engineering system of the Lower Yellow River[C]∥Proceedings of the 15th China Marine (Coastal) Engineering Academic Symposium. Beijing: China Ocean Press, 2011: 1337-1338. (in Chinese) REN Yanfen. The status of Dongping lake flood detention area in the flood control engineering system of the Lower Yellow River[C]∥Proceedings of the 15th China Marine (Coastal) Engineering Academic Symposium. Beijing: China Ocean Press, 2011: 1337-1338. (in Chinese)
[4] 郭亚梅, 任东红. 南水北调东线背景下东平湖综合效益的发挥[J]. 人民黄河,2012,34(11):23-25. (GUO Yamei, REN Donghong. Dongping lake impounding influence treatment works under the background of the South-to-North Water Transfer Project (east route)[J]. Yellow River, 2012, 34(11): 23-25. (in Chinese) GUO Yamei, REN Donghong. Dongping lake impounding influence treatment works under the background of the South-to-North Water Transfer Project (east route)[J]. Yellow River, 2012, 34(11): 23-25. (in Chinese)
[5] 徐羽, 傅维军, 赵艳, 等. 甬江流域鄞州平原区极端洪水对暴雨的响应特征[J]. 水利水运工程学报,2024(3):52-61. (XU Yu, FU Weijun, ZHAO Yan, et al. Variations in extreme water level responses to rainstorms in the Yinzhou Plain of the Yongjiang River Basin[J]. Hydro-Science and Engineering, 2024(3): 52-61. (in Chinese) XU Yu, FU Weijun, ZHAO Yan, et al. Variations in extreme water level responses to rainstorms in the Yinzhou Plain of the Yongjiang River Basin[J]. Hydro-Science and Engineering, 2024(3): 52-61. (in Chinese)
[6] 程红. 变化环境下台风与非台风暴雨的洪水响应差异研究[D]. 福州: 福建师范大学, 2022. (CHENG Hong. Study on flood response difference between typhoon and non-typhoon rainstorm under changing environment[D]. Fuzhou: Fujian Normal University, 2022. (in Chinese) CHENG Hong. Study on flood response difference between typhoon and non-typhoon rainstorm under changing environment[D]. Fuzhou: Fujian Normal University, 2022. (in Chinese)
[7] 张春玲, 王文民, 程慧, 等. 大汶河大汶口(临汶)水文站历年洪水特性分析[J]. 水利科技与经济,2017,23(3):50-54. (ZHANG Chunling, WANG Wenmin, CHENG Hui, et al. Analysis of flood characteristics of Dawenkou (Linwen) hydrological station of Dawenhe River over the years[J]. Water Conservancy Science and Technology and Economy, 2017, 23(3): 50-54. (in Chinese) ZHANG Chunling, WANG Wenmin, CHENG Hui, et al. Analysis of flood characteristics of Dawenkou (Linwen) hydrological station of Dawenhe River over the years[J]. Water Conservancy Science and Technology and Economy, 2017, 23(3): 50-54. (in Chinese)
[8] 谢莉, 张亚伟. 皇甫川流域生态环境变化下暴雨洪水特性分析[C]∥2022(第十届)中国水生态大会论文集. 北京: 海洋出版社, 2022: 790-796. (XIE Li, ZHANG Yawei. Analysis of rainstorm flood characteristics under ecological environment change in Huangfuchuan Basin∥Proceedings of the 10th China Water Ecology Conference in 2022. Beijing: China Ocean Press, 2022: 790-796. (in Chinese) XIE Li, ZHANG Yawei. Analysis of rainstorm flood characteristics under ecological environment change in Huangfuchuan Basin∥Proceedings of the 10th China Water Ecology Conference in 2022. Beijing: China Ocean Press, 2022: 790-796. (in Chinese)
[9] 宁黛. 2021年呼玛河流域暴雨洪水特性分析[J]. 水利科学与寒区工程,2021,4(6):161-164. (NING Dai. Analysis on rainstorm flood characteristics in the Huma River Basin in 2021[J]. Hydro Science and Cold Zone Engineering, 2021, 4(6): 161-164. (in Chinese) NING Dai. Analysis on rainstorm flood characteristics in the Huma River Basin in 2021[J]. Hydro Science and Cold Zone Engineering, 2021, 4(6): 161-164. (in Chinese)
[10] 邹嘉福, 刘正伟. 昆明城市暴雨洪水特性分析[J]. 水电能源科学,2013,31(1):42-45, 187. (ZOU Jiafu, LIU Zhengwei. Analysis of storm flood characteristics of Kunming City[J]. Water Resources and Power, 2013, 31(1): 42-45, 187. (in Chinese) ZOU Jiafu, LIU Zhengwei. Analysis of storm flood characteristics of Kunming City[J]. Water Resources and Power, 2013, 31(1): 42-45, 187. (in Chinese)
[11] MACHADO R E, CARDOSO T, MORTENE M H. Determination of the runoff coefficient (C) in catchments based on analysis of precipitation and flow events[J]. International Soil and Water Conservation Research, 2022, 10(2): 208-216. doi: 10.1016/j.iswcr.2021.09.001
[12] HU H Y, LIU Z P. Study on the variation characteristics of rainstorm and flood in Puyang River Basin[J]. IOP Conference Series: Earth and Environmental Science, 2020, 508: 012096. doi: 10.1088/1755-1315/508/1/012096
[13] 毕婉, 王建群, 丁建华. 基于新安江模型的考虑超渗产流及塘坝调蓄的洪水过程模拟[J]. 水电能源科学,2017,35(2):75-78. (BI Wan, WANG Jianqun, DING Jianhua. Simulation of flood process based Xinanjiang model in consideration of infiltration-excess runoff and storage of ponds[J]. Water Resources and Power, 2017, 35(2): 75-78. (in Chinese) BI Wan, WANG Jianqun, DING Jianhua. Simulation of flood process based Xinanjiang model in consideration of infiltration-excess runoff and storage of ponds[J]. Water Resources and Power, 2017, 35(2): 75-78. (in Chinese)
[14] 王秉顺. 大汶河流域地质构造特征及其对地下水控制作用研究[D]. 青岛: 山东科技大学, 2019. (WANG Bingshun. Study on geological structural characteristics and the controlling functions on groundwater in Dawen River Basin[D]. Qingdao: Shandong University of Science and Technology, 2019. (in Chinese) WANG Bingshun. Study on geological structural characteristics and the controlling functions on groundwater in Dawen River Basin[D]. Qingdao: Shandong University of Science and Technology, 2019. (in Chinese)
[15] 陈立华, 陈云瑶, 滕翔. 西江流域灾害性暴雨洪水特征及成因分析[J]. 水文,2020,40(5):71-77, 84. (CHEN Lihua, CHEN Yunyao, TENG Xiang. Characteristics and genesis analysis of disastrous rainstorm flood in Xijiang River Basin[J]. Journal of China Hydrology, 2020, 40(5): 71-77, 84. (in Chinese) CHEN Lihua, CHEN Yunyao, TENG Xiang. Characteristics and genesis analysis of disastrous rainstorm flood in Xijiang River Basin[J]. Journal of China Hydrology, 2020, 40(5): 71-77, 84. (in Chinese)
[16] 郑彦辰, 李建柱, 荣佑同, 等. 降雨时空分布量化及其在洪水过程分类中的应用[J]. 水利学报,2022,53(5):560-573. (ZHENG Yanchen, LI Jianzhu, RONG Youtong, et al. Quantification of rainfall spatial and temporal distribution characteristics on the flood hydrograph and its application in flood type classification[J]. Journal of Hydraulic Engineering, 2022, 53(5): 560-573. (in Chinese) ZHENG Yanchen, LI Jianzhu, RONG Youtong, et al. Quantification of rainfall spatial and temporal distribution characteristics on the flood hydrograph and its application in flood type classification[J]. Journal of Hydraulic Engineering, 2022, 53(5): 560-573. (in Chinese)
[17] ZOCCATELLI D, BORGA M, VIGLIONE A, et al. Spatial moments of catchment rainfall: rainfall spatial organisation, basin morphology, and flood response[J]. Hydrology and Earth System Sciences, 2011, 15(12): 3767-3783. doi: 10.5194/hess-15-3767-2011
[18] TAYLOR J M G. Kendall’s and Spearman’s correlation coefficients in the presence of a blocking variable[J]. Biometrics, 1987, 43(2): 409. doi: 10.2307/2531822
[19] ABDI H. The kendall rank correlation coefficient[J]. Encyclopedia of Measurement and Statistics, 2007, 2: 508-510.
[20] 芮孝芳. 产流模式的发现与发展[J]. 水利水电科技进展,2013,33(1):1-6, 26. (RUI Xiaofang. The discovery and development of runoff formation models[J]. Advances in Science and Technology of Water Resources, 2013, 33(1): 1-6, 26. (in Chinese) RUI Xiaofang. The discovery and development of runoff formation models[J]. Advances in Science and Technology of Water Resources, 2013, 33(1): 1-6, 26. (in Chinese)
[21] SCAIFE C I, SINGH N K, EMANUEL R E, et al. Non-linear quickflow response as indicators of runoff generation mechanisms[J]. Hydrological Processes, 2020, 34(13): 2949-2964. doi: 10.1002/hyp.13780
[22] 张春霞, 周爱民, 孙婧. 大汶河流域“2020·8” 连续性暴雨洪水特性分析[J]. 水资源开发与管理,2021(10):80-84. (ZHANG Chunxia, ZHOU Aimin, SUN Jing. Analysis of “2020·8” continuous rainstorm and flood characteristics in Dawen River Basin[J]. Water Resources Development and Management, 2021(10): 80-84. (in Chinese) ZHANG Chunxia, ZHOU Aimin, SUN Jing. Analysis of “2020·8” continuous rainstorm and flood characteristics in Dawen River Basin[J]. Water Resources Development and Management, 2021(10): 80-84. (in Chinese)
-
期刊类型引用(1)
1. 汪航. 丹丹乌里克沟径流特征与洪水规律研究. 水利技术监督. 2025(05): 205-209 .  百度学术
百度学术
其他类型引用(0)
计量
- 文章访问数: 126
- HTML全文浏览量: 63
- PDF下载量: 54
- 被引次数: 1
